If there is anything you need to know about X (Twitter) analytics is that it’s crucial to know your way around it in order to grow your business online.
The secret to grow your brand on social media growth is in your X (Twitter) analytics. If you don’t know how to measure your reach, engagement and brand perception, how do you know if your online marketing is working? How do you know what content works the best?
In this complete guide to X (Twitter) analytics, you’ll learn:
- How to access and use X/Twitter Analytics
- The top 5 key metrics to track on X/Twitter Analytics
- How to identify your best performing content
- The top 5 X (Twitter) analytics tools for 2024
What is X (formerly Twitter) Analytics?
X/Twitter analytics is a free, built-in tool that provides key metrics for tracking your account's performance. It offers insights into follower count, engagement, impressions, retweets, and more. This data is invaluable for businesses seeking to refine their social media approach and maximize their online presence.
Accessing X/Twitter Analytics (on Desktop)
Visit https://analytics.twitter.com and log in with your X/Twitter account.
Alternatively, access via the main X/Twitter sidebar and:
- Click the "More" (...) option in the left sidebar
- Select "Creator Studio"
- Click "Analytics"
If you are a X Premium user, visit **https://x.com/i/account_analytics** and log in with your X/Twitter account or:
- Click the "X Premium" option in the left sidebar
- Go to "Analytics" in the menu that opens up
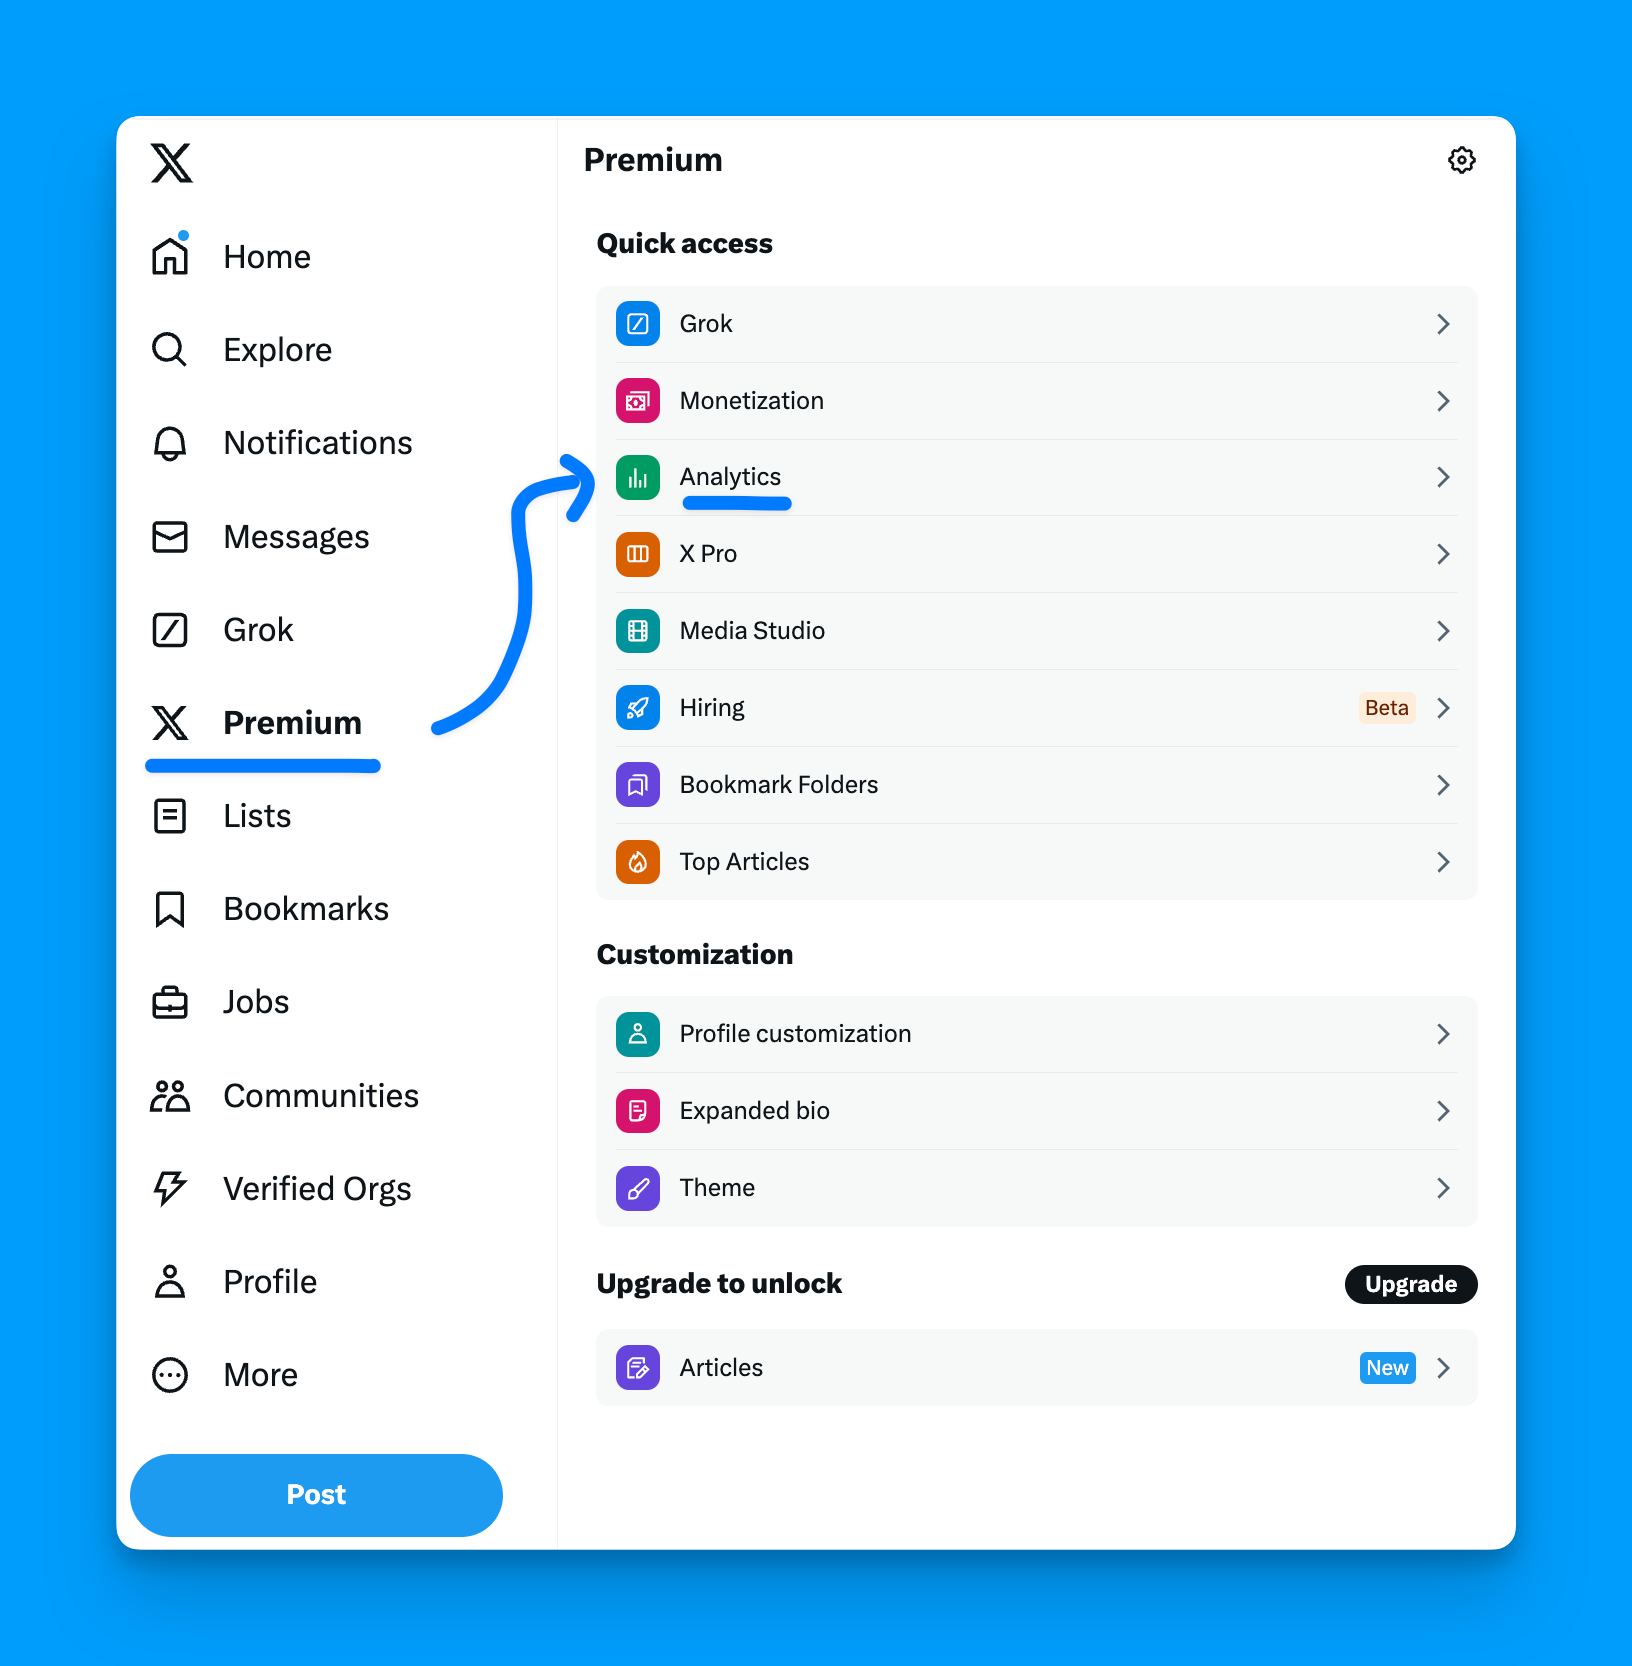
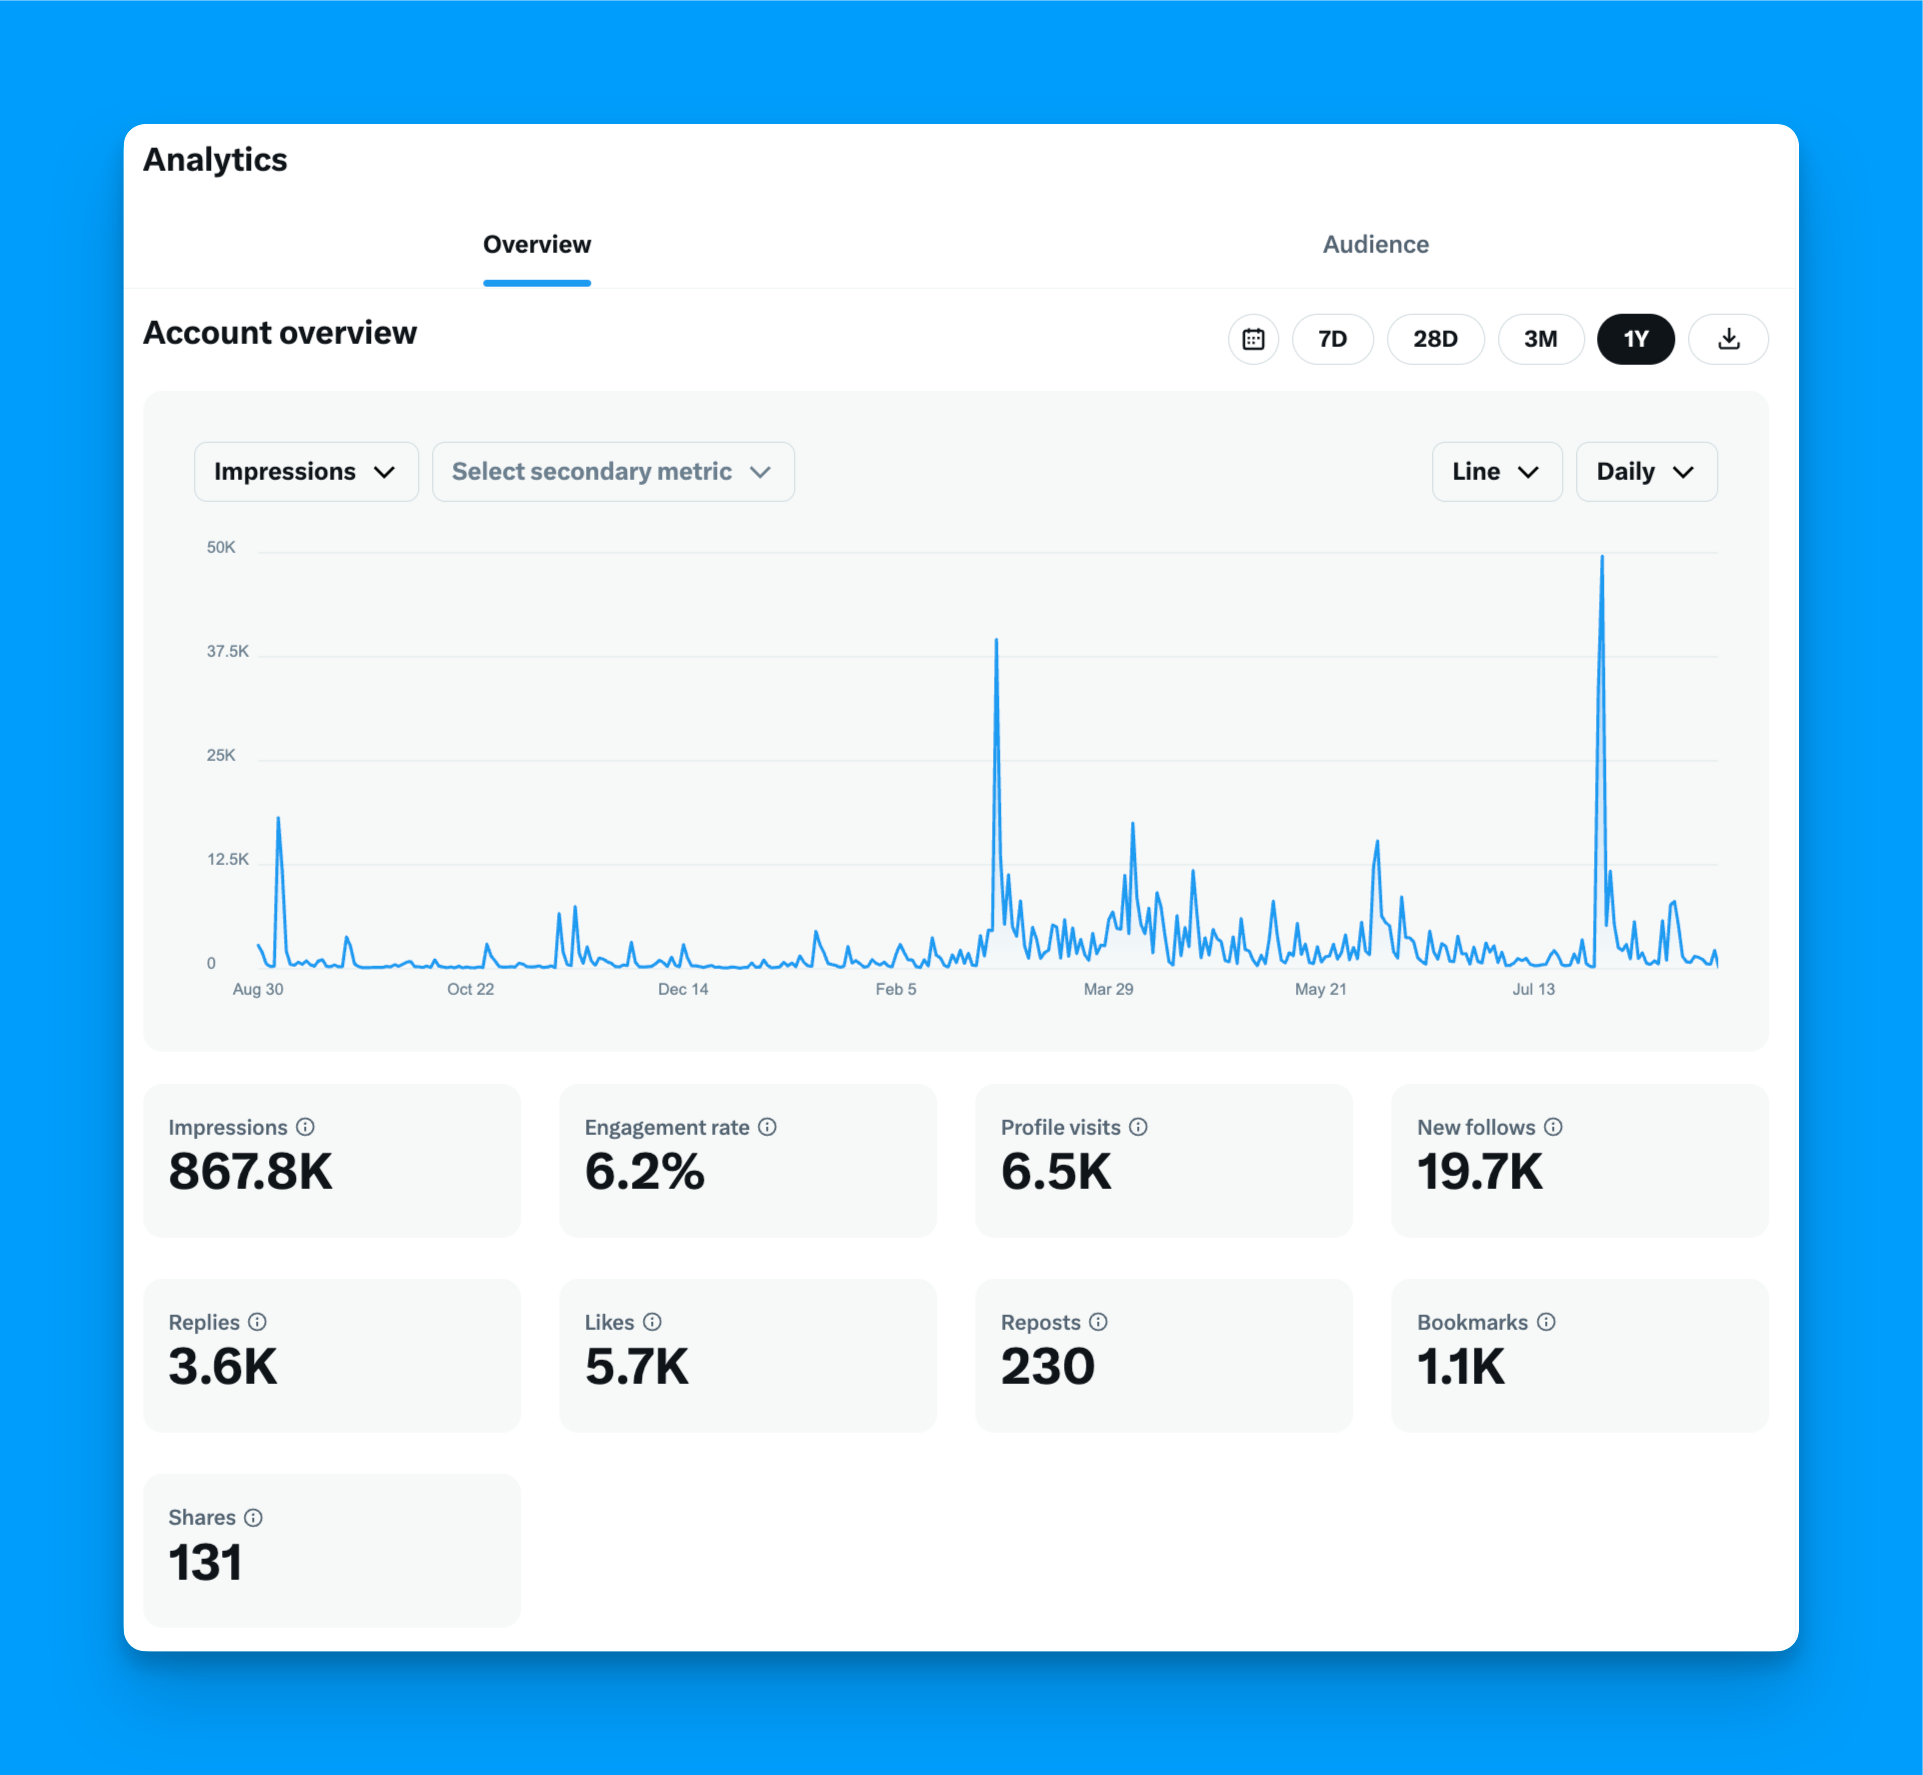
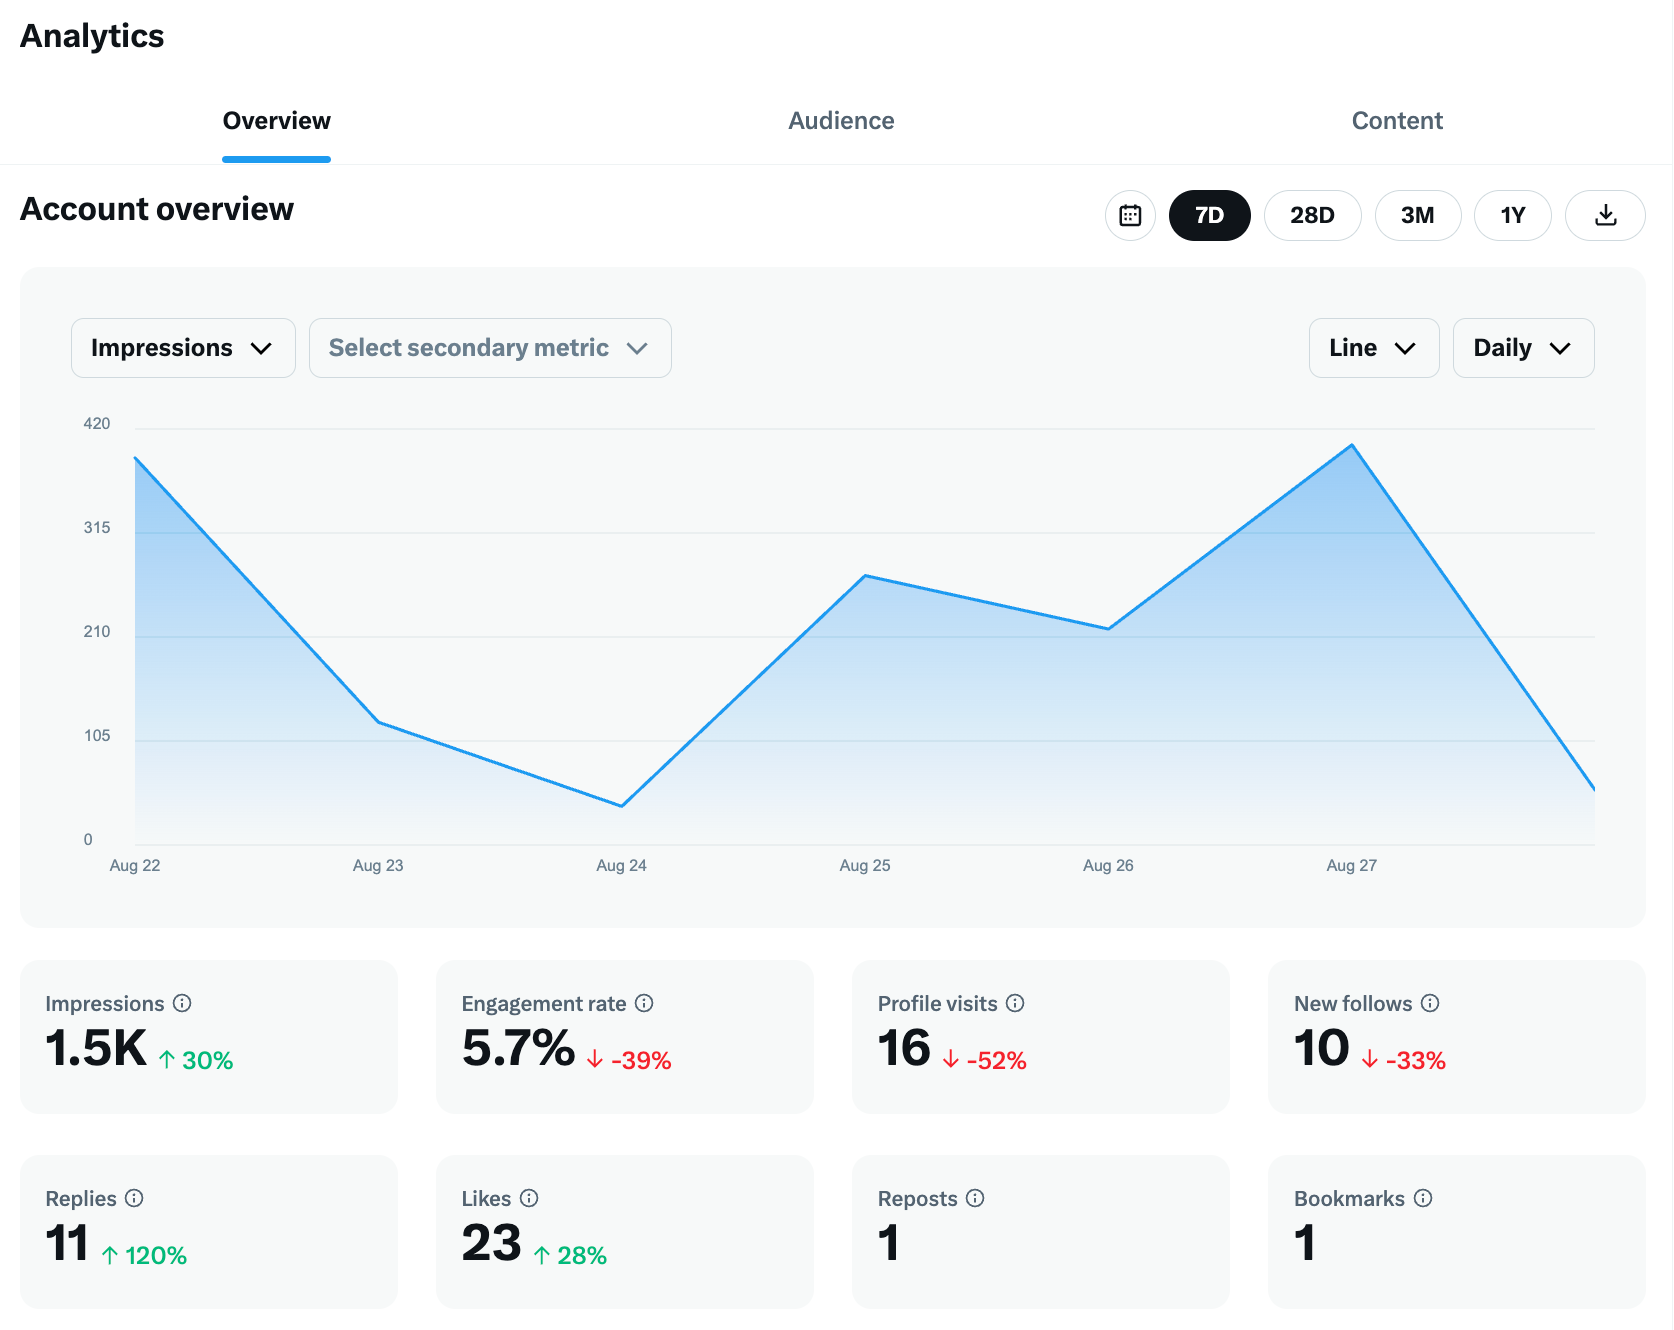
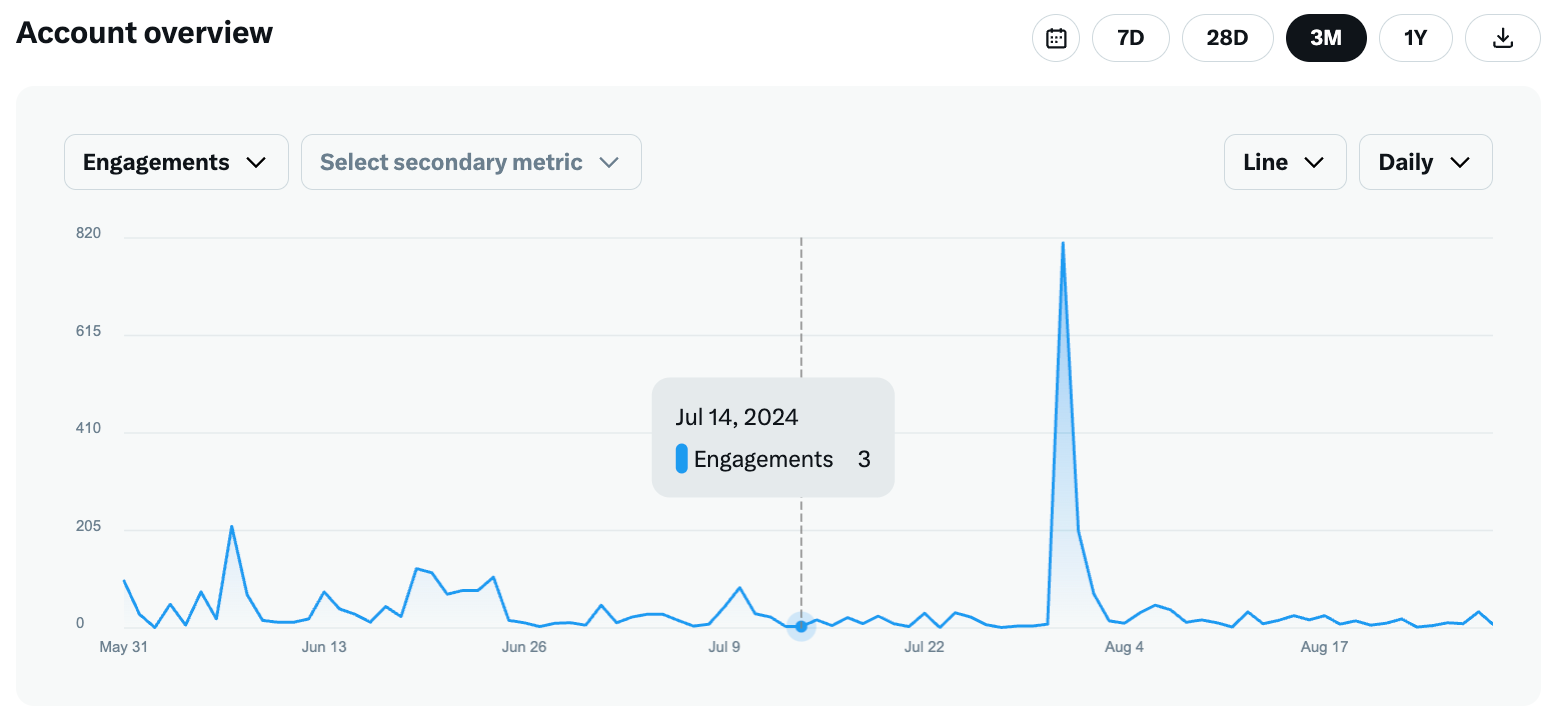
After doing that, it will open up the main X/Twitter Analytics Dashboard where you’ll be able to see your Twitter Account Overview, Audience’s Details and Demographics, as well as a list of all your Content that was published and how it performed on X/Twitter.
By clicking on your X/Twitter Analytics “Content” tab, you’ll open up a table with all your Twitter posts, replies and community posts with all the metrics associated.
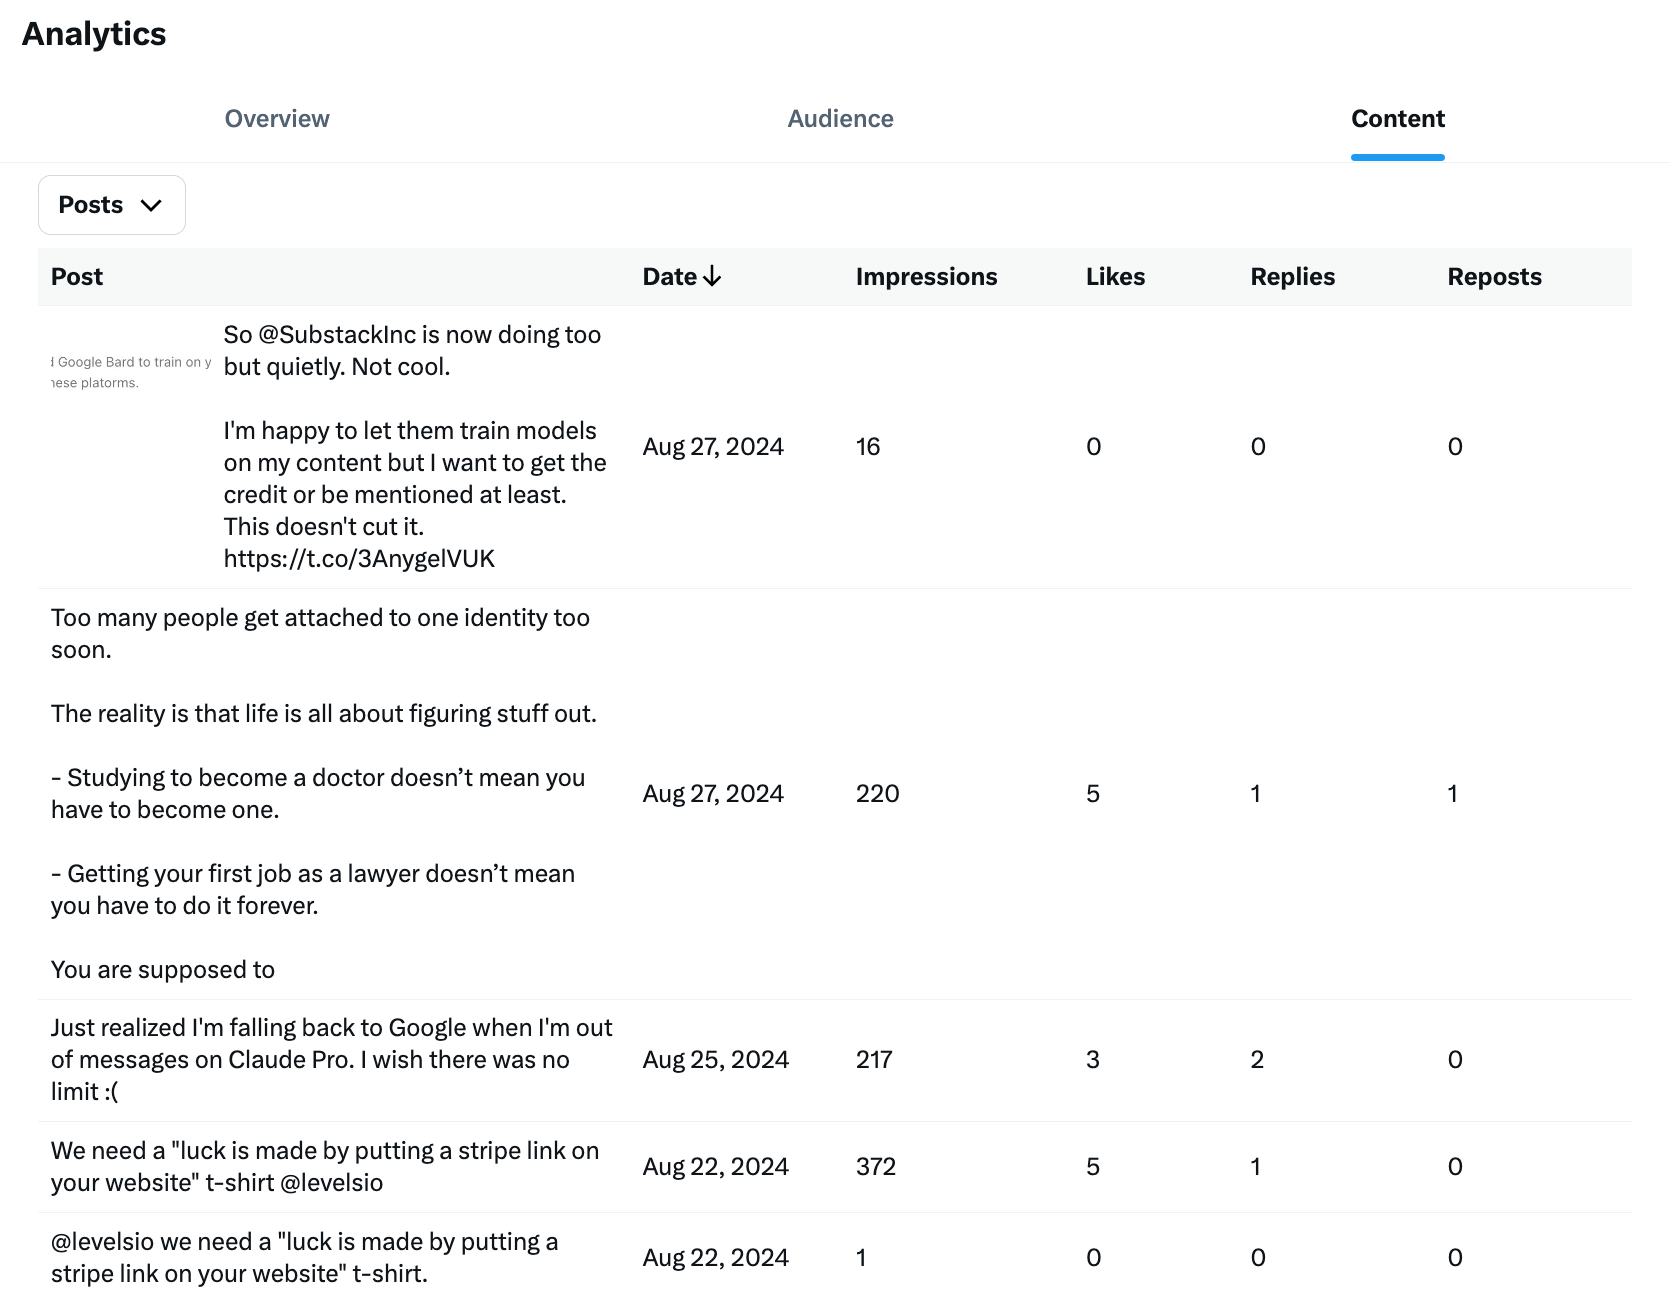
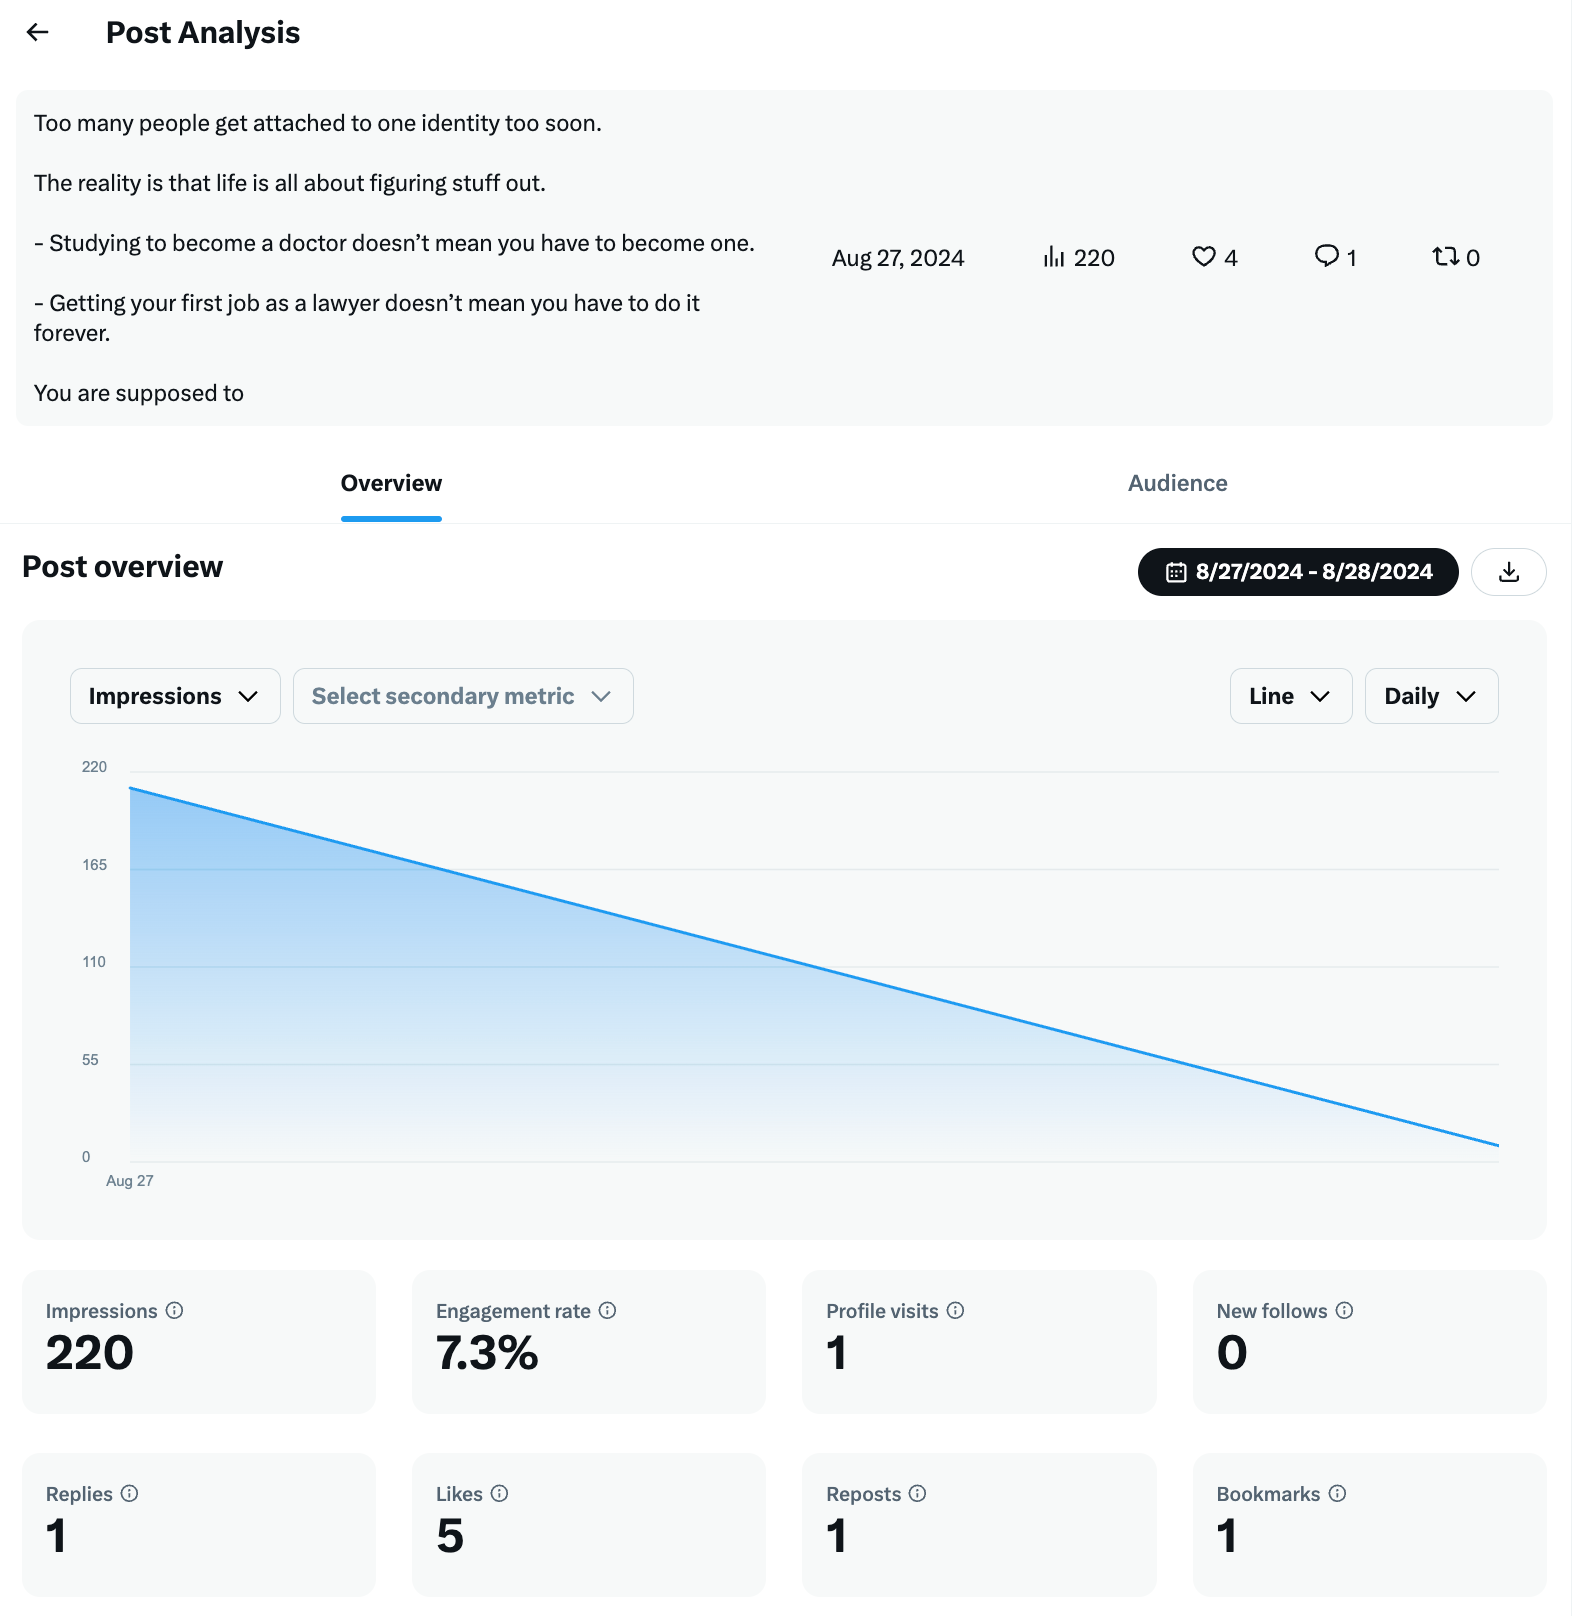
Further clicking in a specific post, will also open up that Twitter post’s individual X/Twitter analytics page where you get an overview on how it performed.
Accessing X/Twitter Analytics (on Mobile)
On mobile devices, you can access the same data you can see on desktop by following the same instructions above through the sidebar.
For non X Premium users:
- Click the "More" (...) option in the left sidebar
- Select "Creator Studio"
- Click "Analytics"
For X Premium users:
- Click the "X Premium" option in the left sidebar
- Go to "Analytics" in the menu that opens up
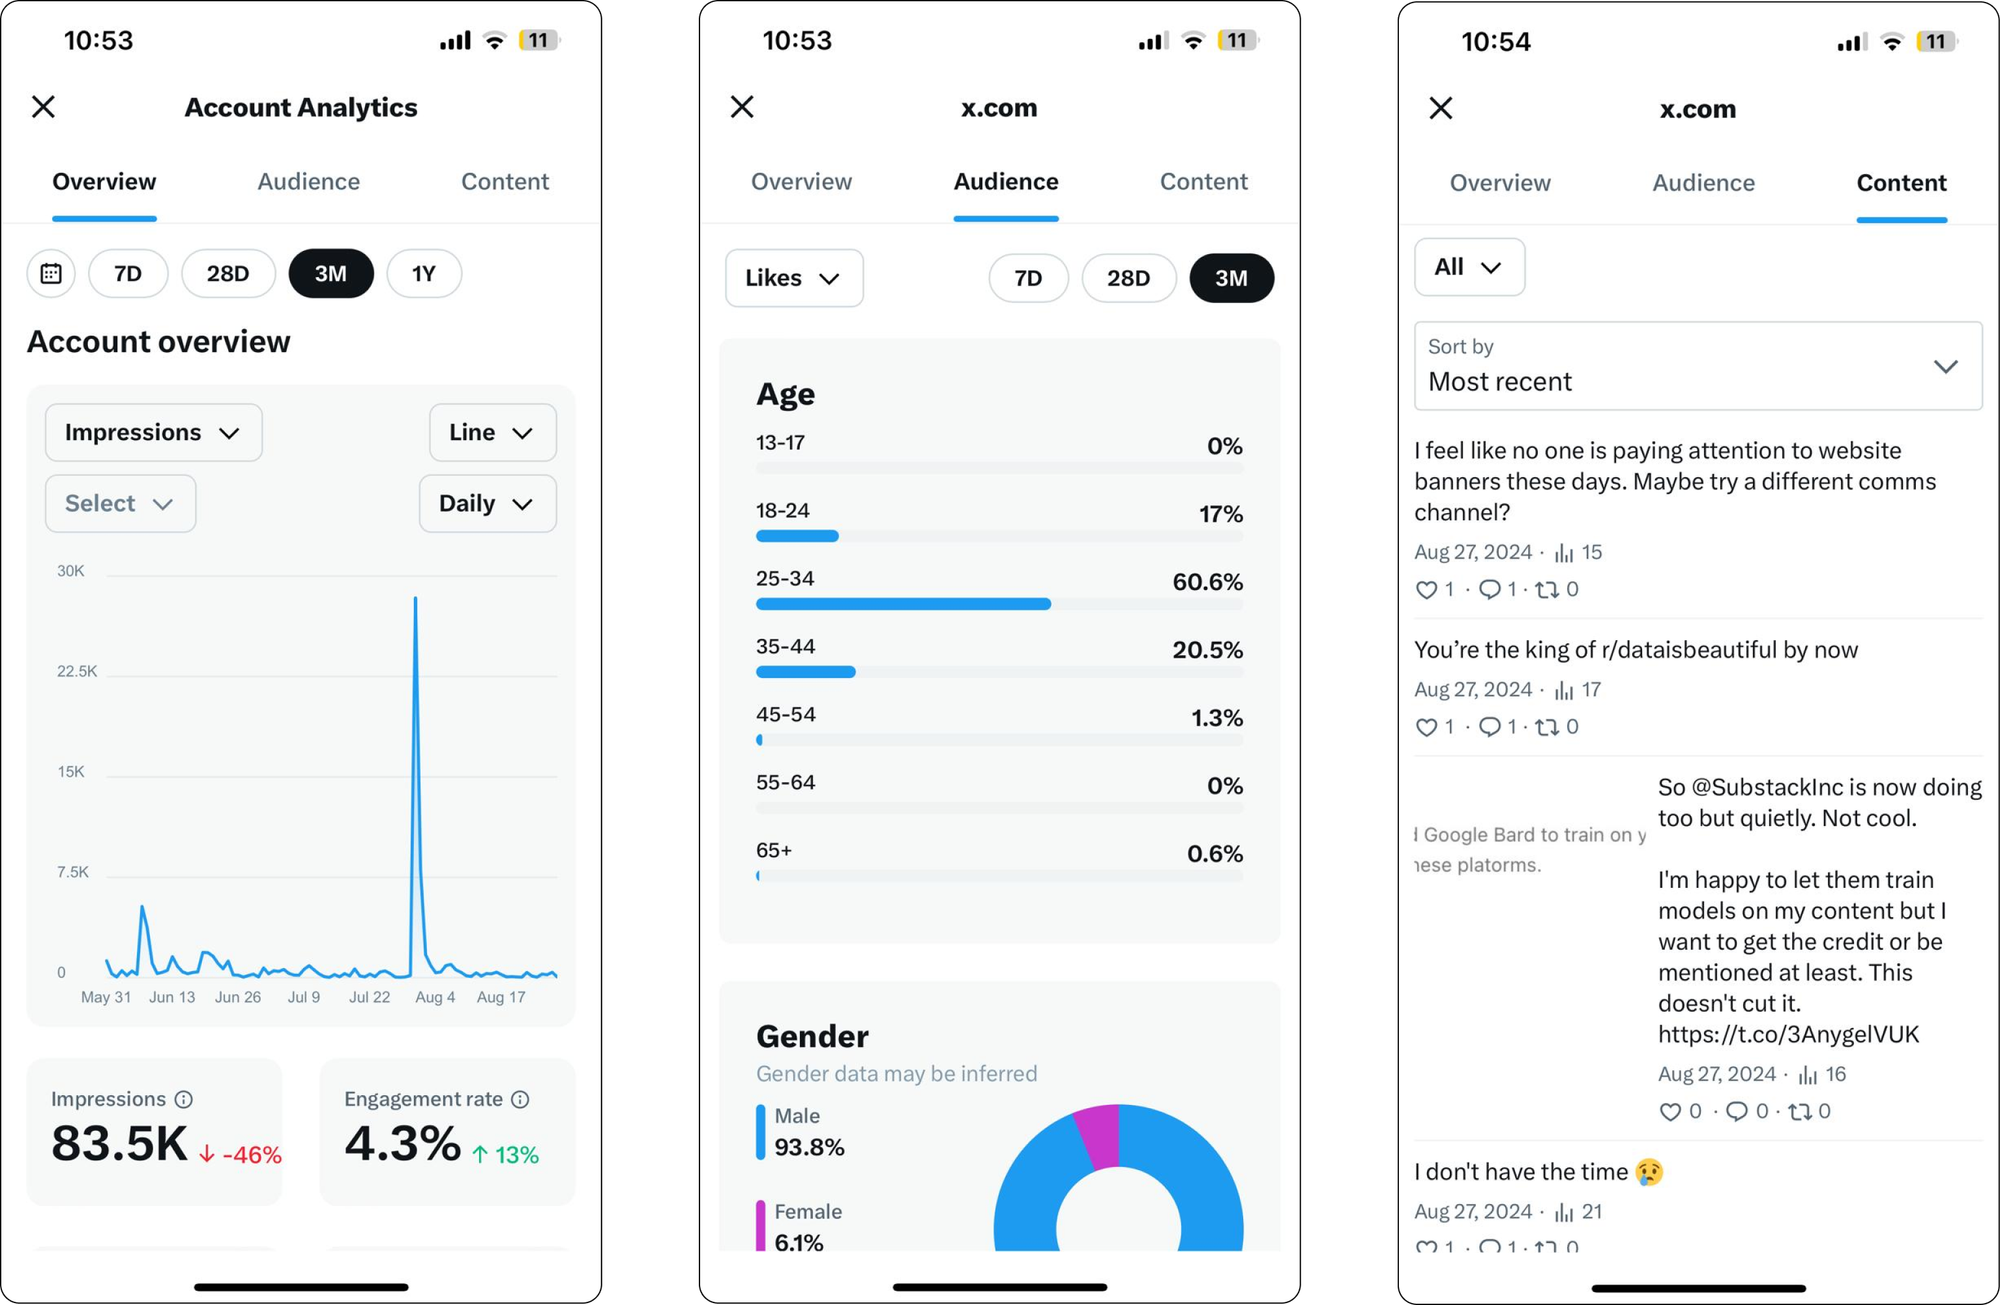
The X/Twitter Analytics dashboard on mobile is the same as on desktop except on a smaller screen. However, all metrics are available. You’ll see the Overview, Audience and Content tabs and can click into it to explore the X/Twitter posts with the most likes, the most impressions, etc.
Accessing X/Twitter Analytics (on Typefully)
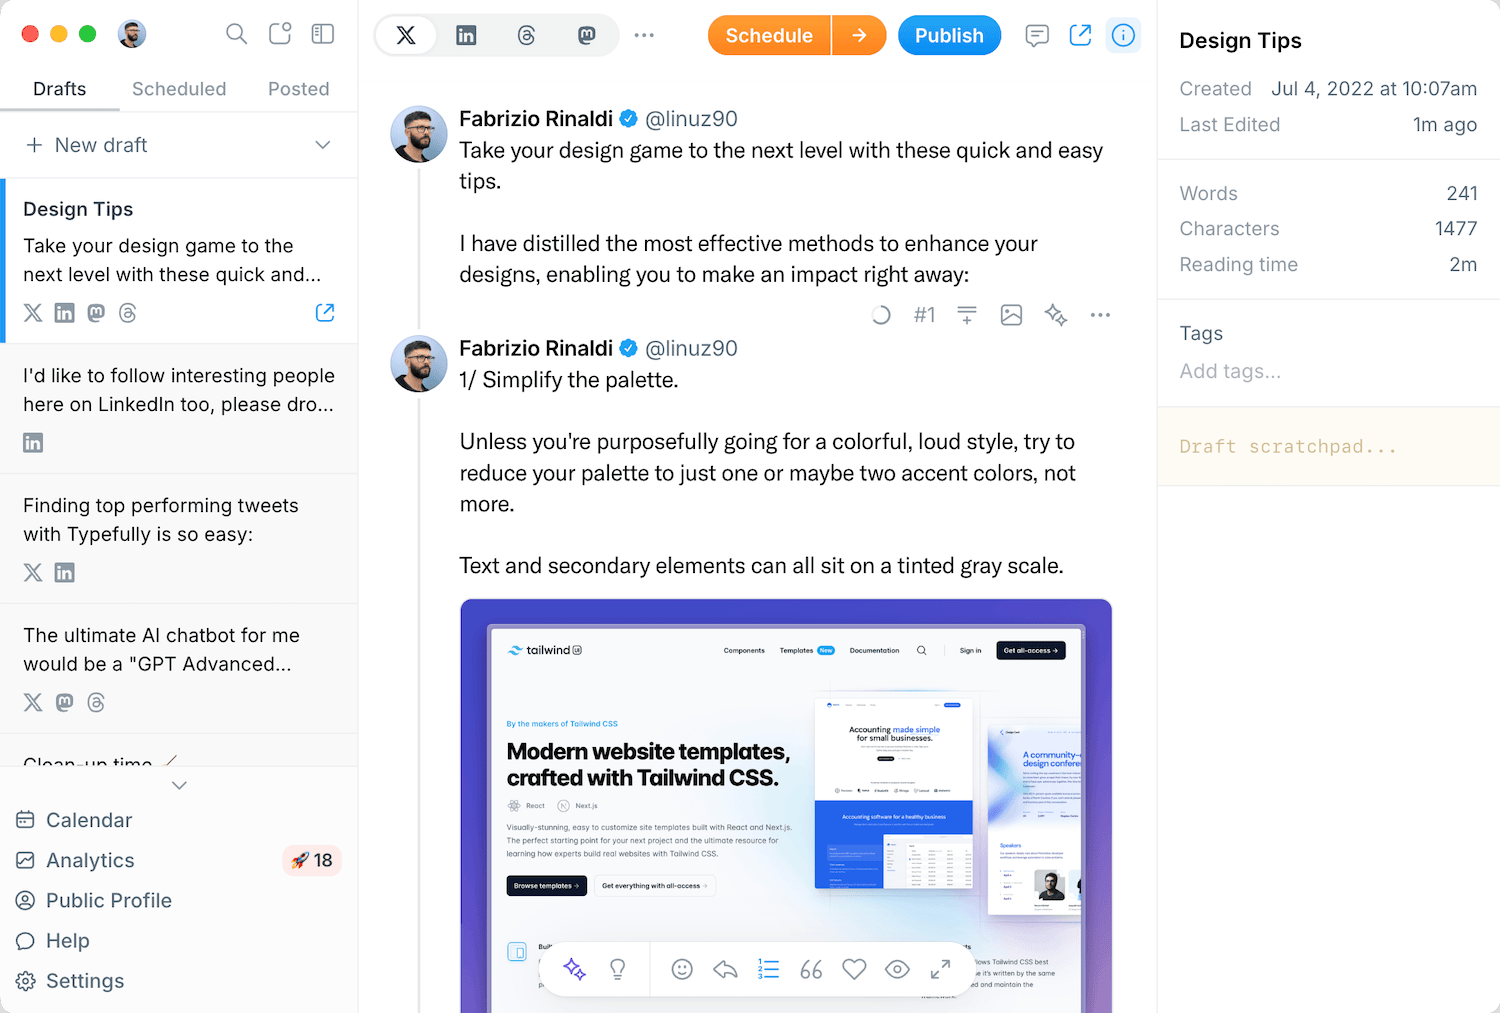
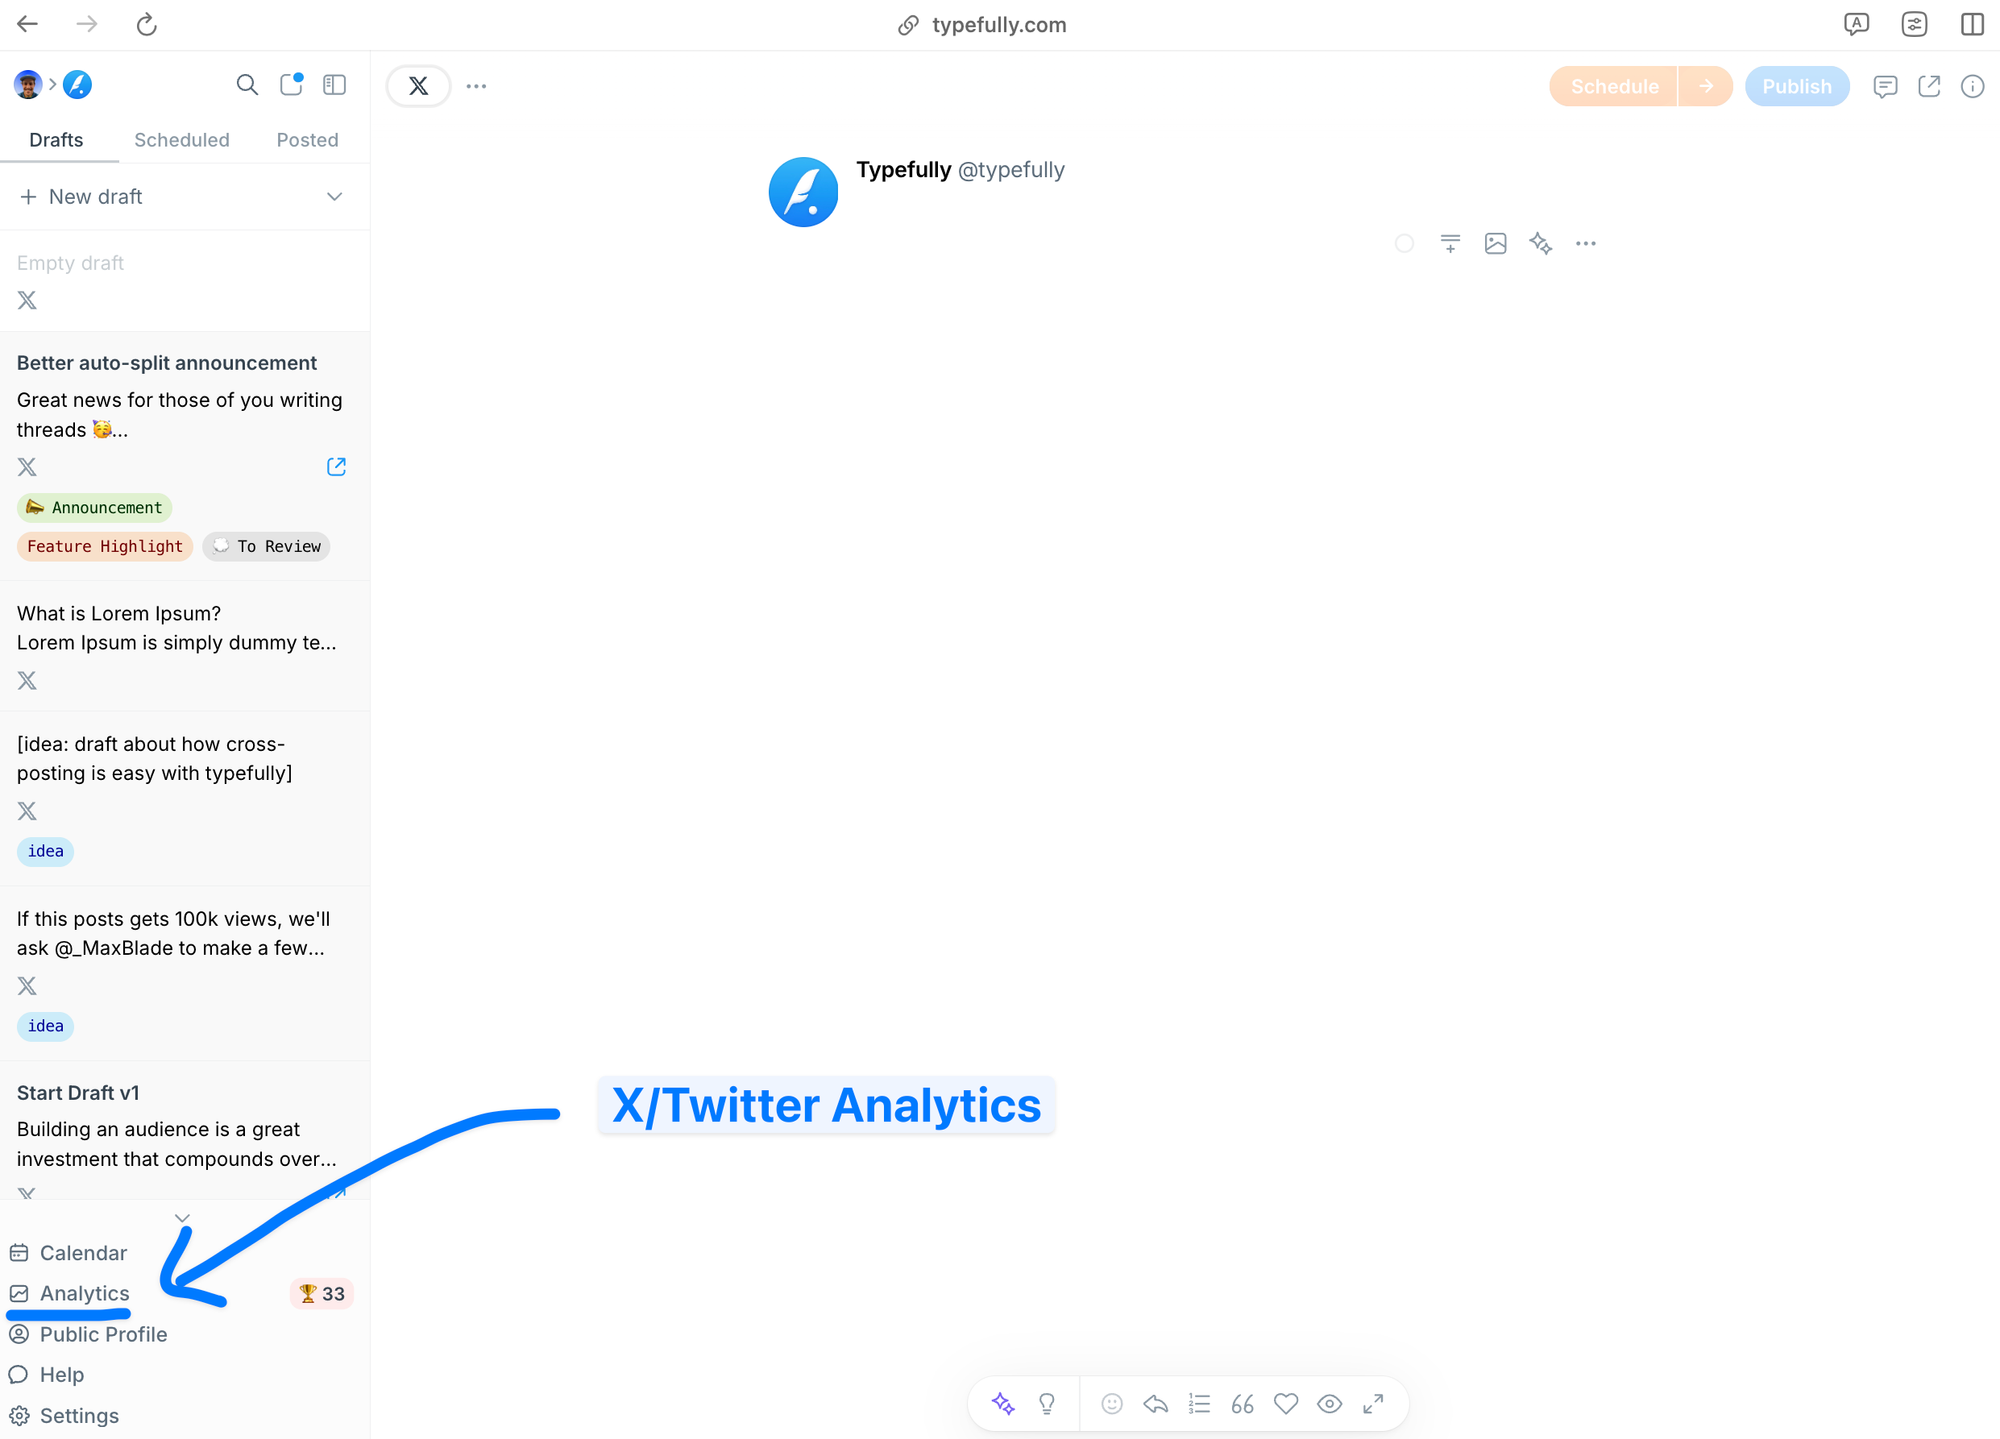
If you don’t fancy the way X/Twitter natively display your the analytics or find it too inaccessible or cluttered, look no further. Typefully has a built-in X/Twitter Analytics dashboard that is beautiful and easy to use, pulling real data from your X/Twitter account in real-time via their official API.
You can easily access it on “Analytics in your Typefully account’s sidebar.
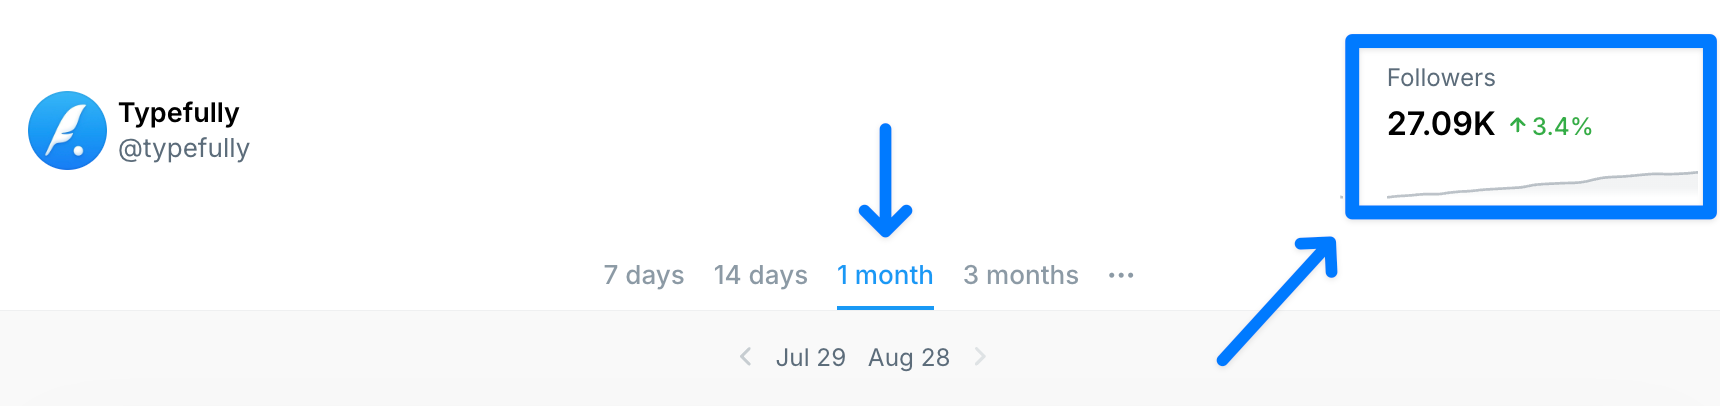
Once you’re in, you’ll see a very clean dashboard with all your important metrics at the top as well as a date filter below it. For the selected date range, you can quickly see:
- Number of X/Twitter posts published
- Total number of impressions
- Total number of profile clicks
- Total number of followers
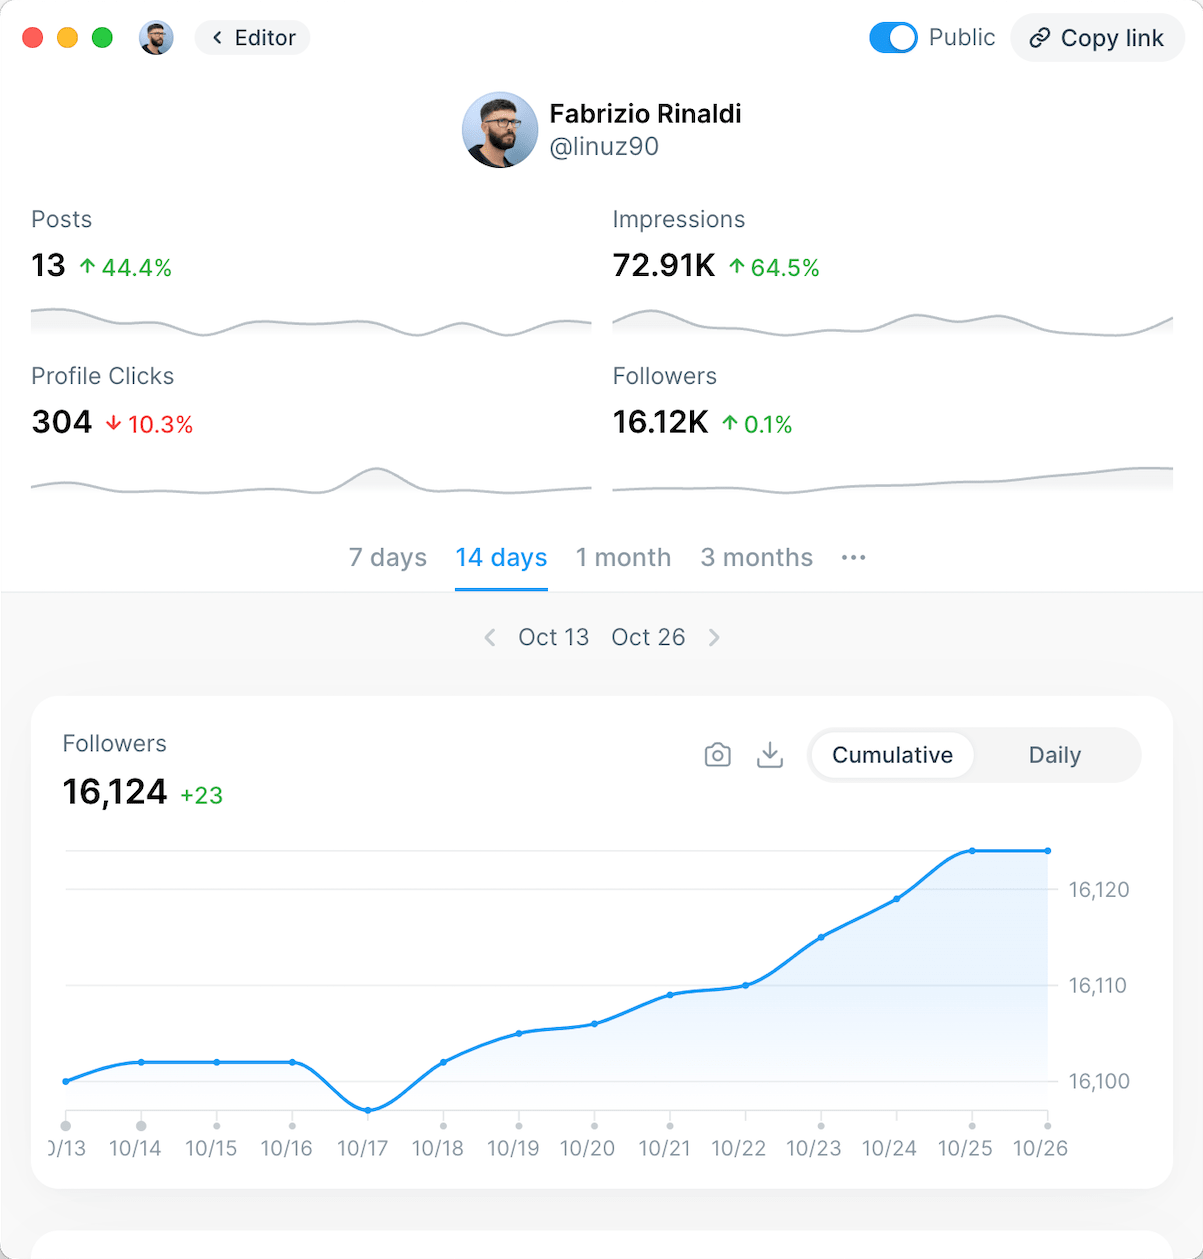
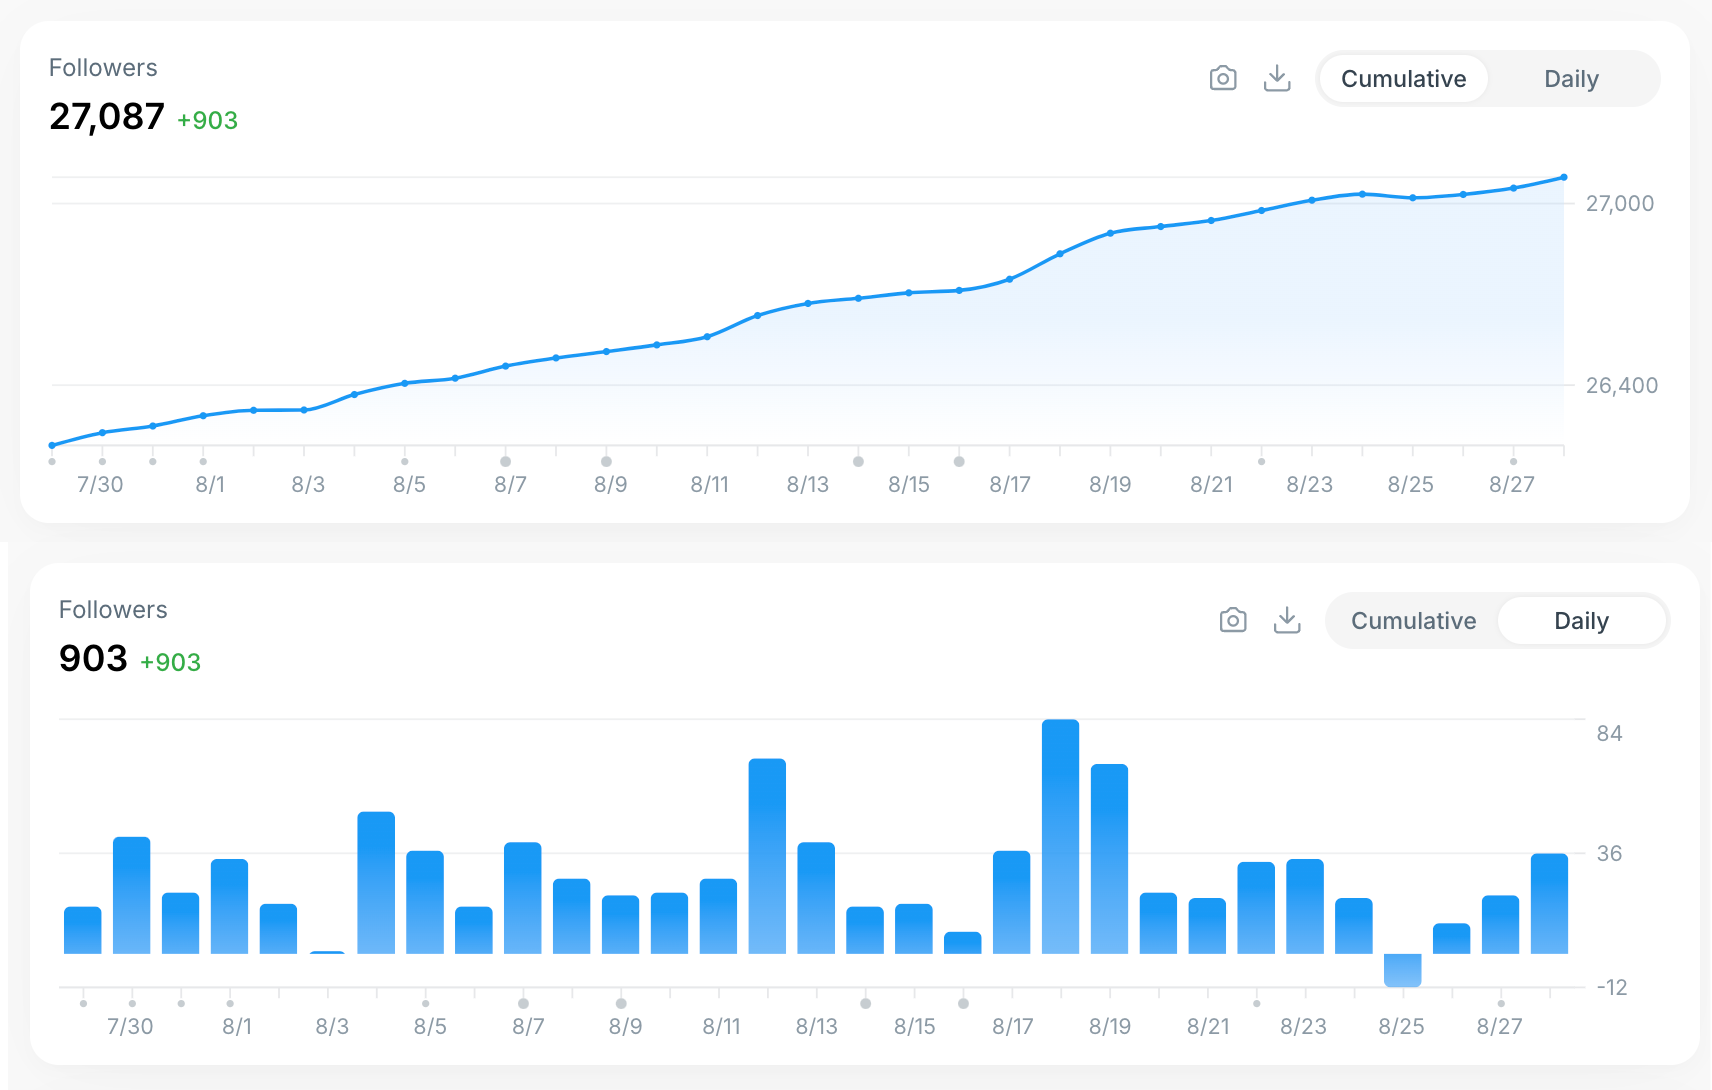
Below that, you’ll see individualized charts for each important metrics in order to analyze how they are varying over time:
- How your followers are growing cumulative or varying daily
- How your impressions are varying daily
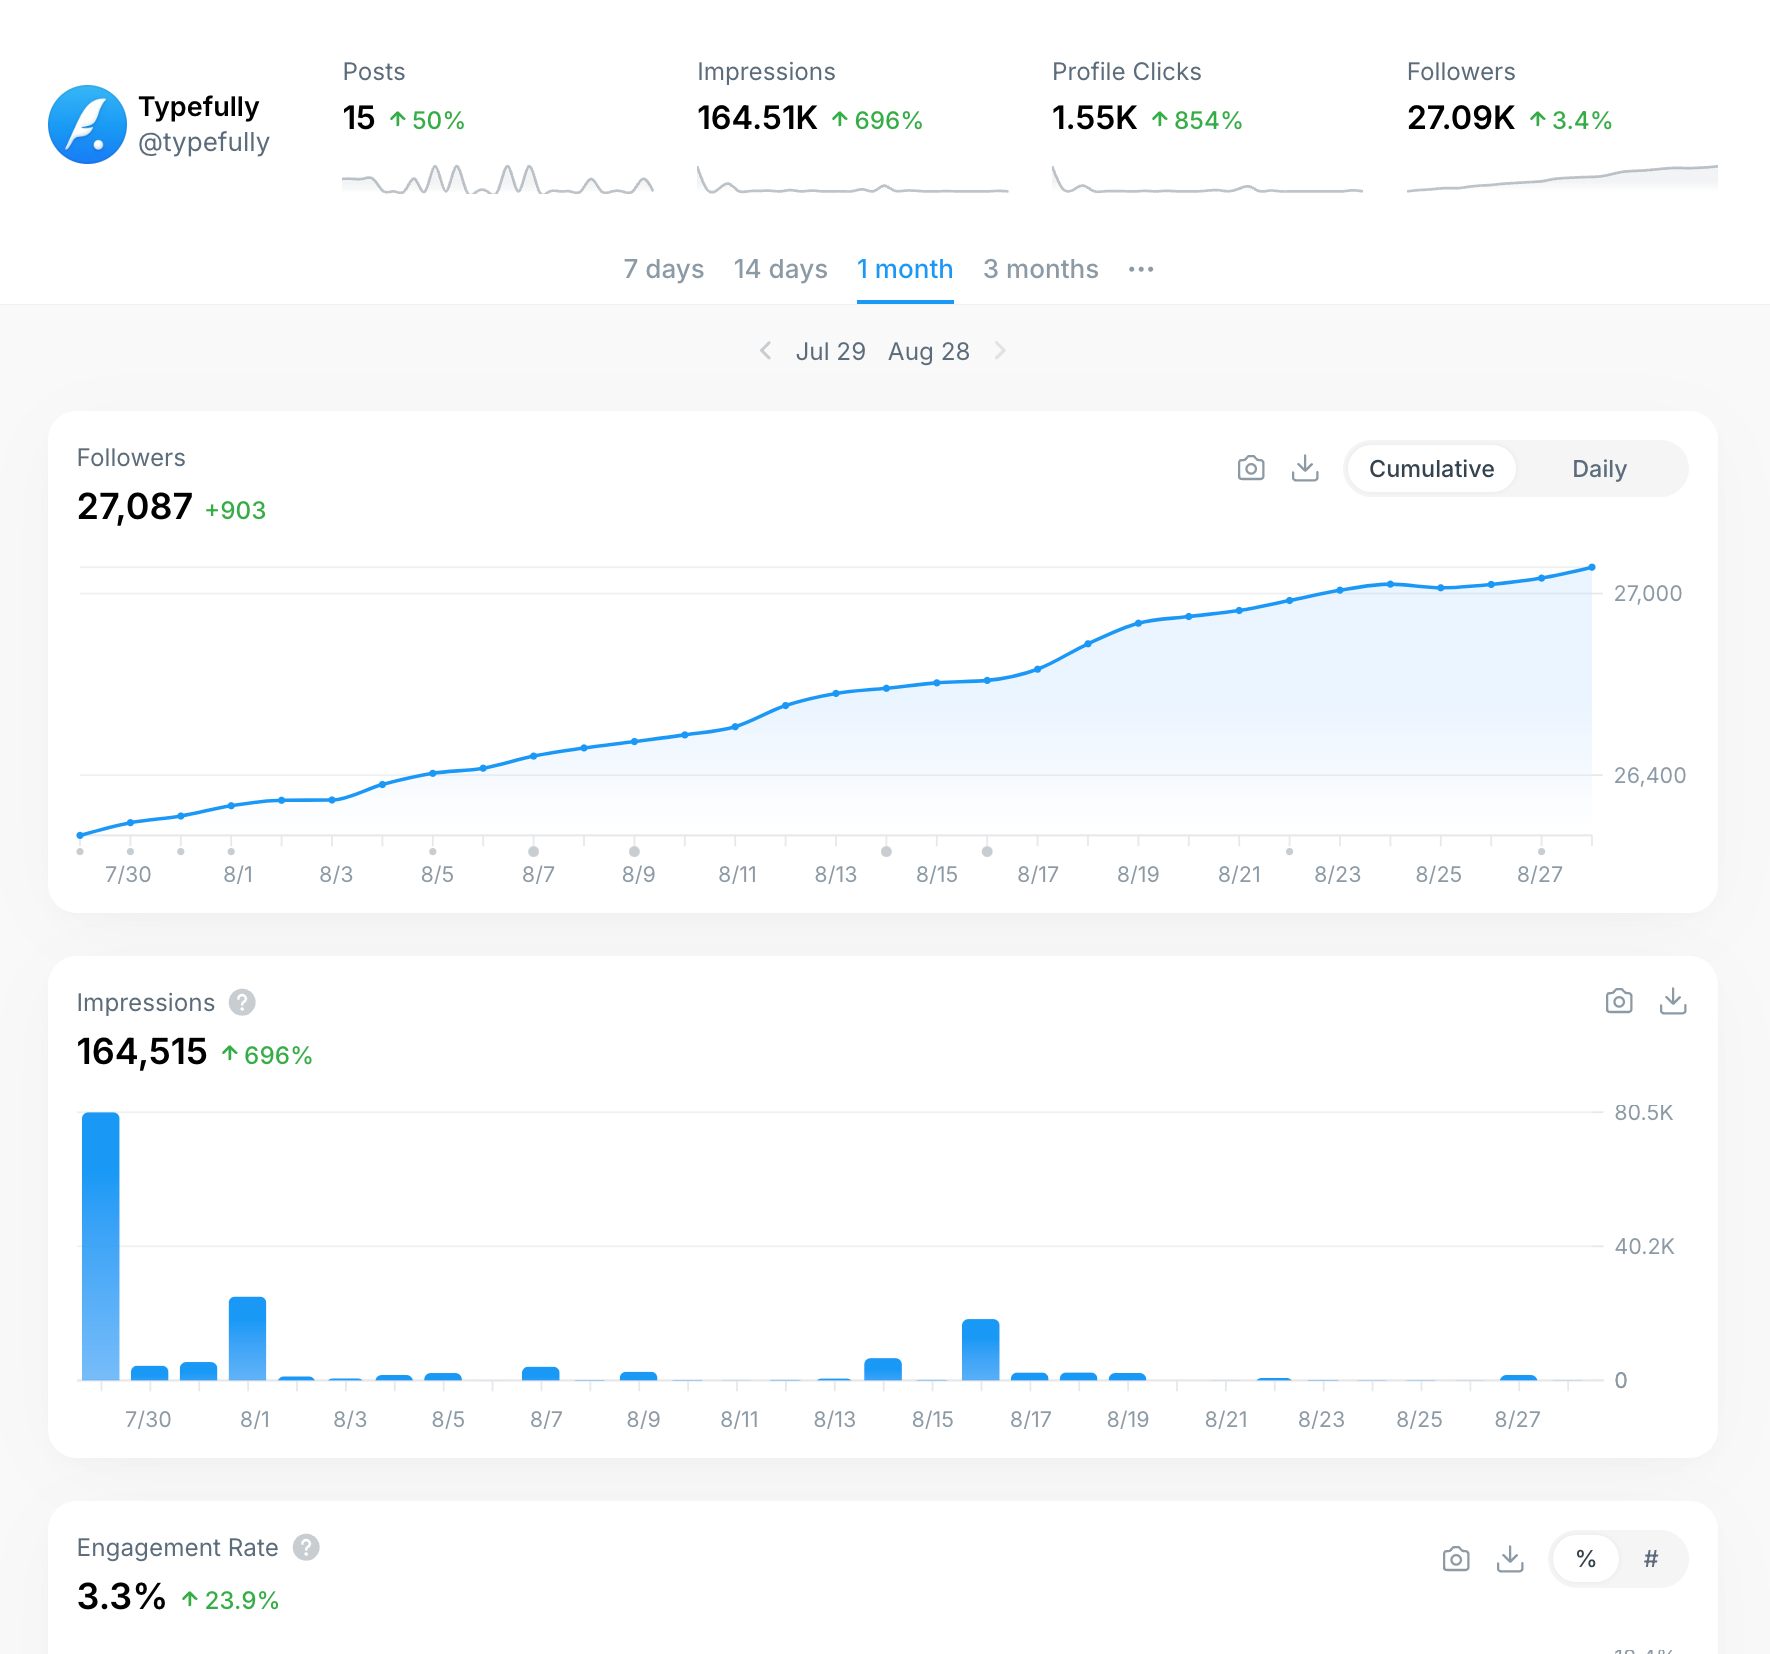
- How your engagement rate is behaving (as a percentage or absolute numbers)
- Your profile conversion rate (as a percentage or absolute numbers)
- Your X/Twitters posts streak (in days or weeks depending on your consistency)
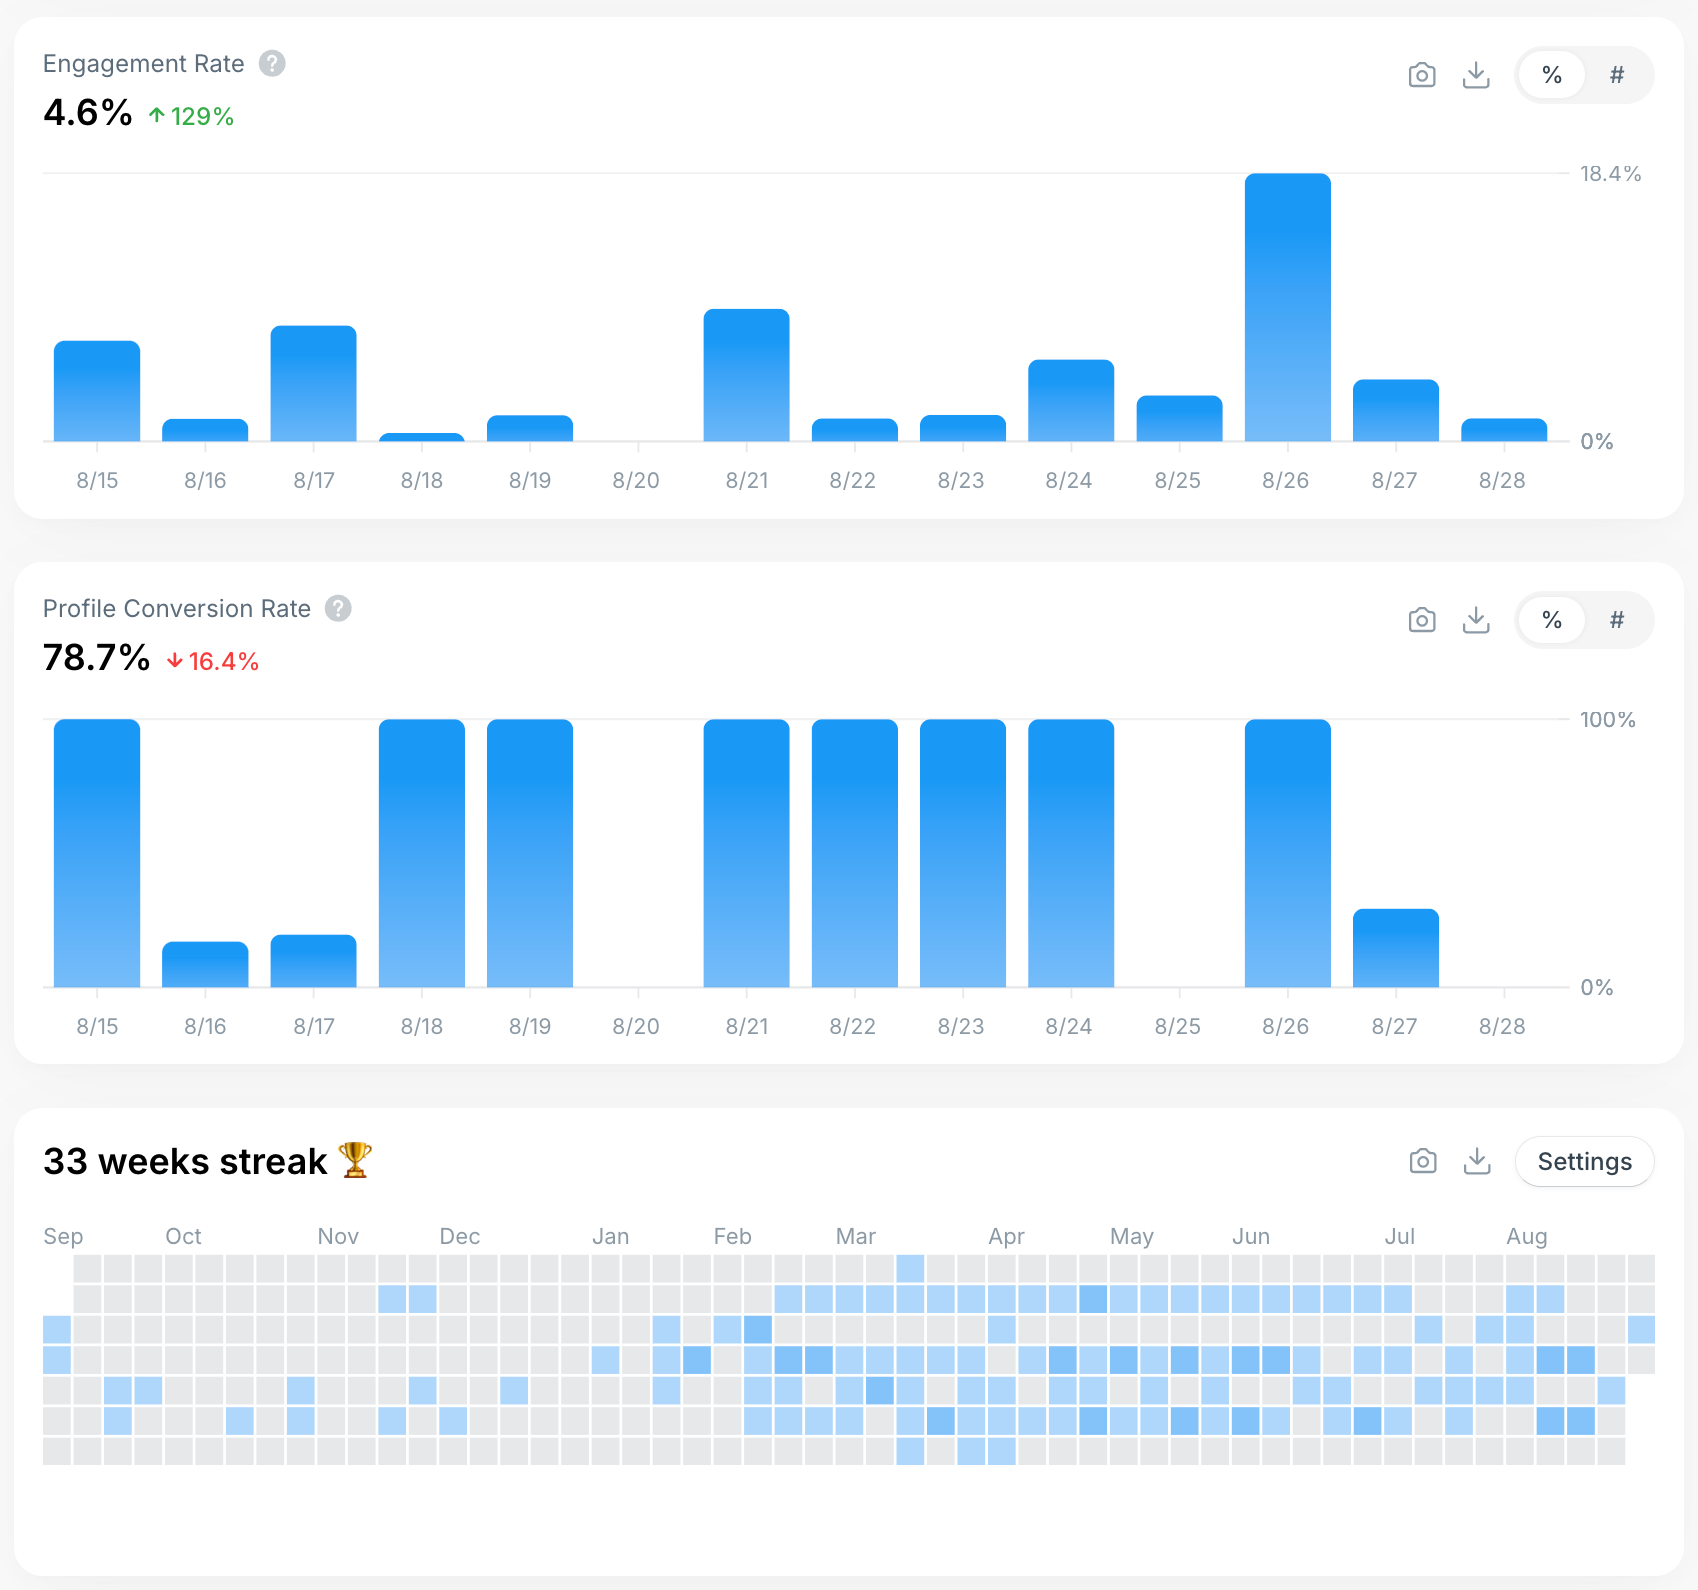
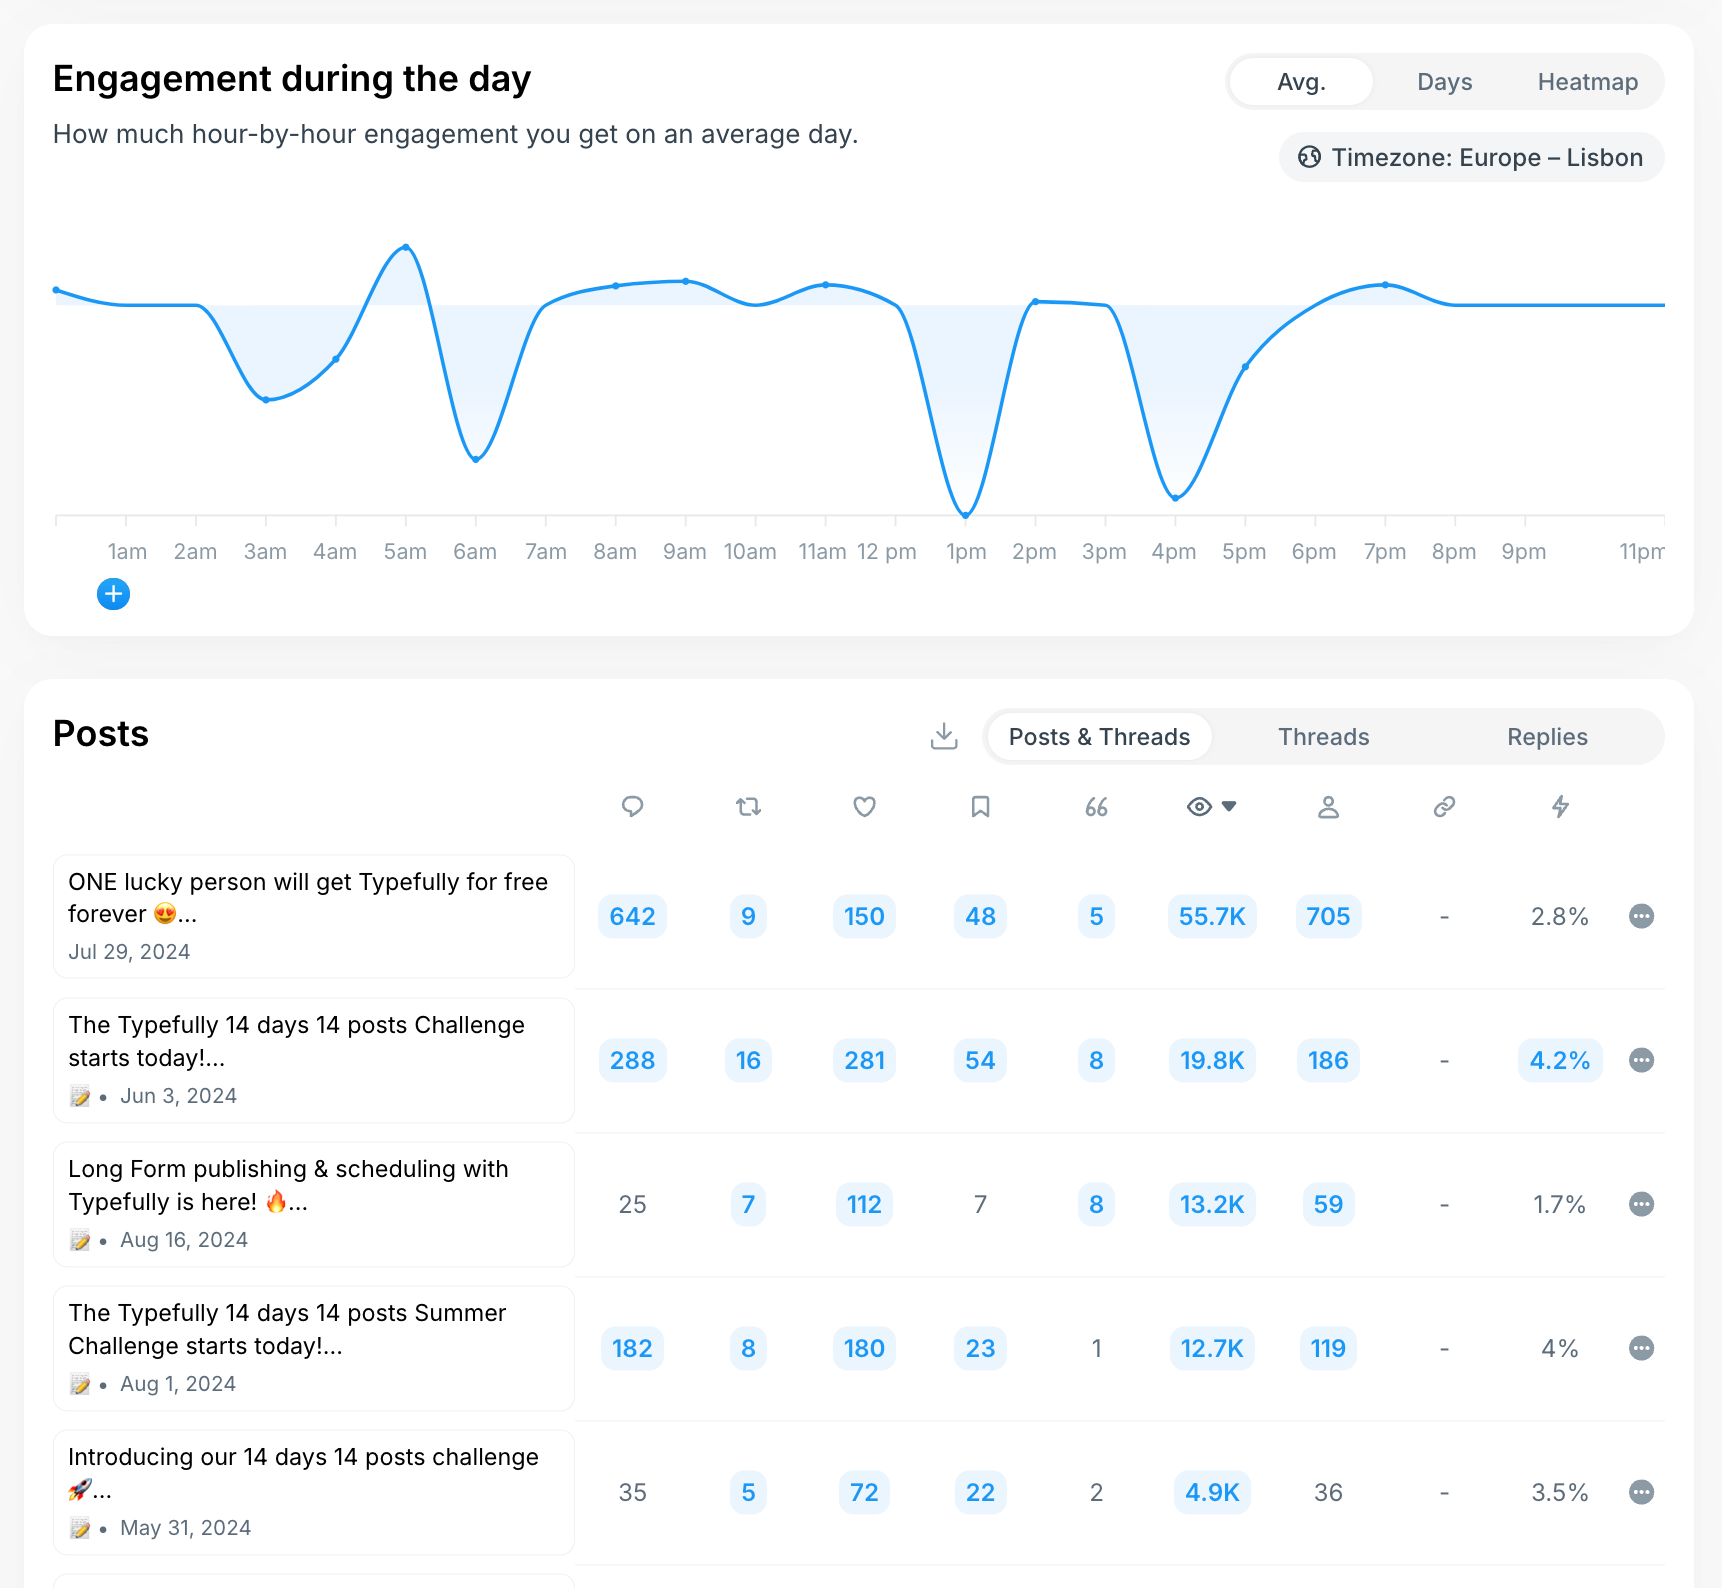
Scrolling down, you’ll also be able to see how your engagement varies throughout the day in order to inform you of the times your audience is most active on X/Twitter. Below that, you’ll see a table with all your Twitter posts, Twitter threads and replies, which you can sort by number of impressions, likes, reposts, profile clicks, engagement rate, etc.
Finally, if you wish to, you can also see the X/Twitter Analytics of other accounts you don’t own and share yours with friends, colleagues or partners/customers.
Ours is public and you can see it here: https://typefully.com/typefully/stats
The top 5 key metrics to track on X (Twitter)
1. Impressions per month
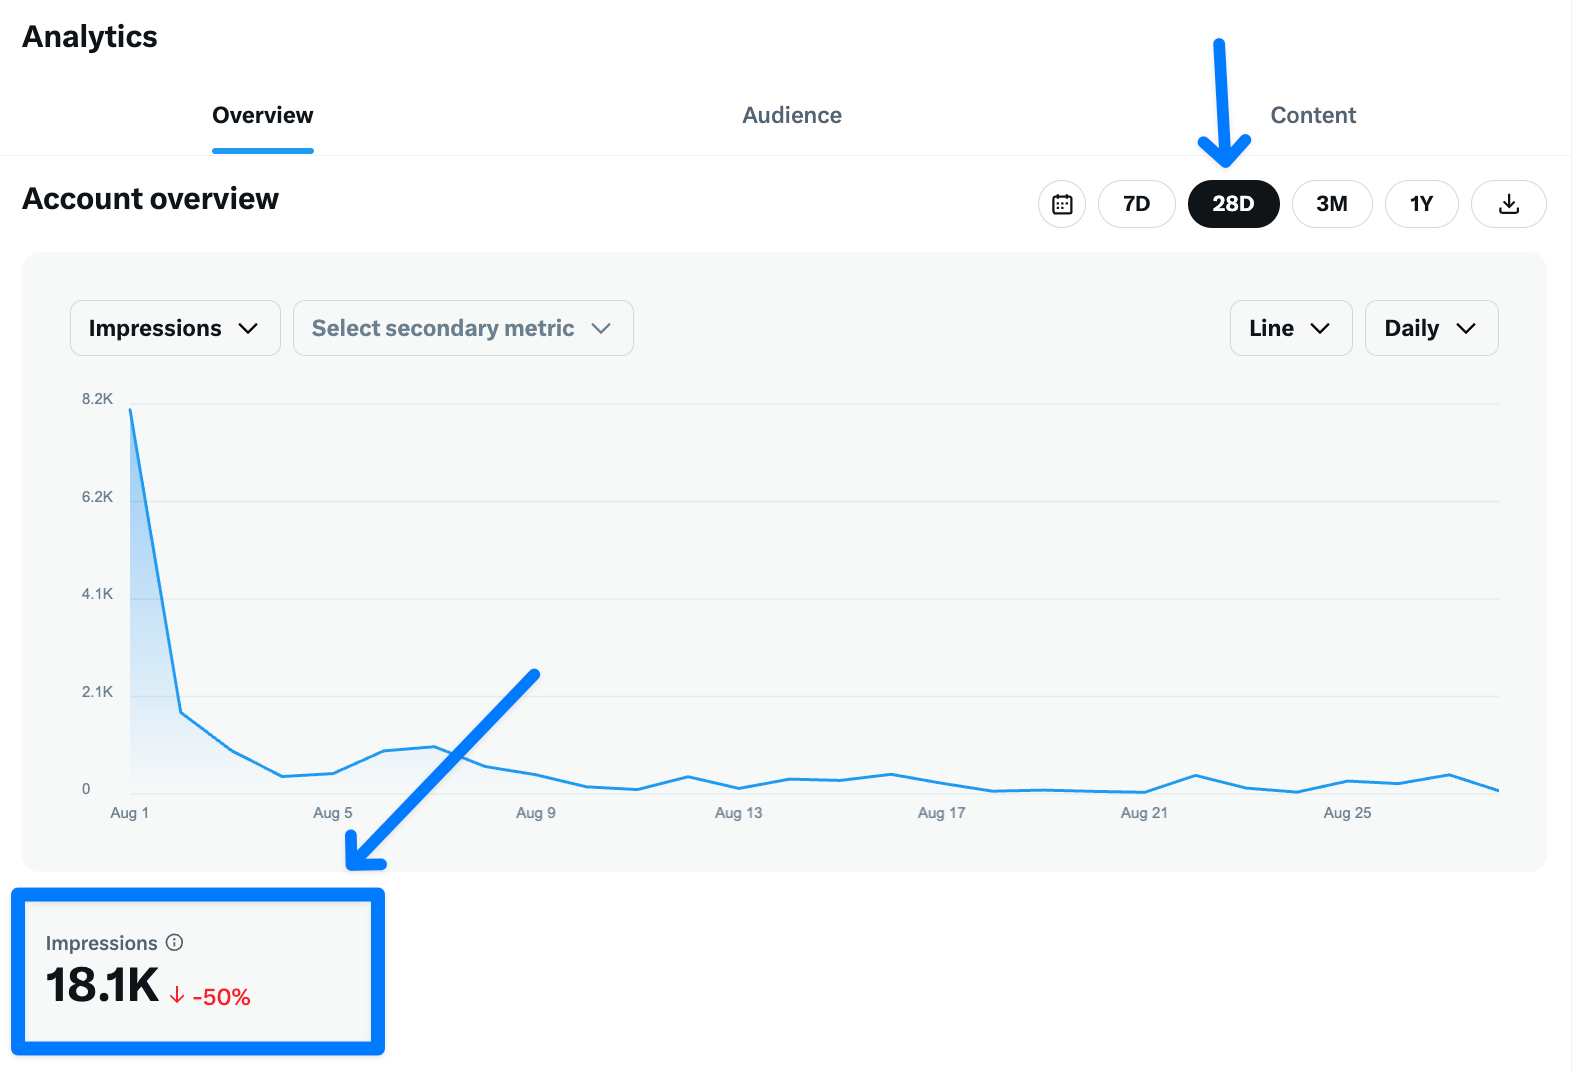
Impressions refer to the number of times your X/Twitter post has appeared on a user’s timeline. Your tweet's impressions are counted when it's shown to your followers, as well as when it appears in search results or when it's retweeted.
Tracking monthly impressions is a good way to know how well your content is performing in terms of reach. Getting more impressions each month is good as it means you’re reaching more people.
You can find this number in your X/Twitter analytics overview page by selecting “28D” (last 28 days” or a custom date range on the left of it.
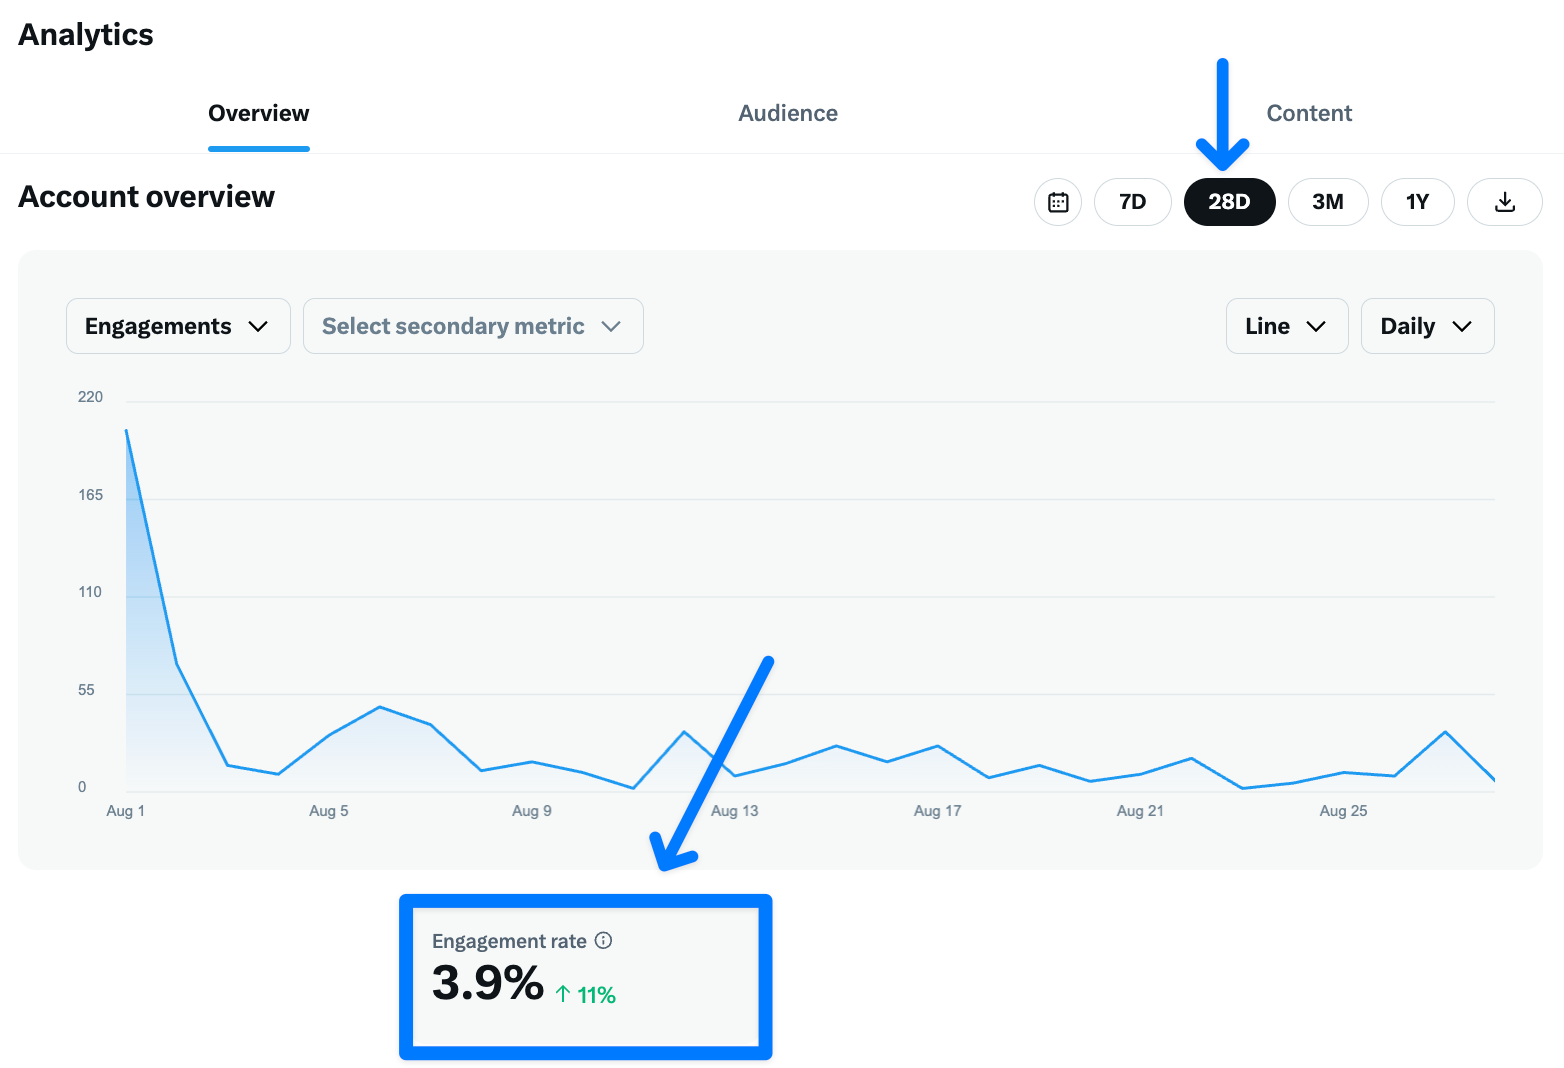
2. Engagement rate
The engagement rate of your content refers to the percentage of people who saw it and took action on it (liked it, commented, reposted, bookmarked, etc). It’s a good indicator of how good and valuable your content is and a good way to know if it has a good fit with your audience.
You can also find it as one of the key metrics on the overview tab in your X/Twitter analytics dashboard.
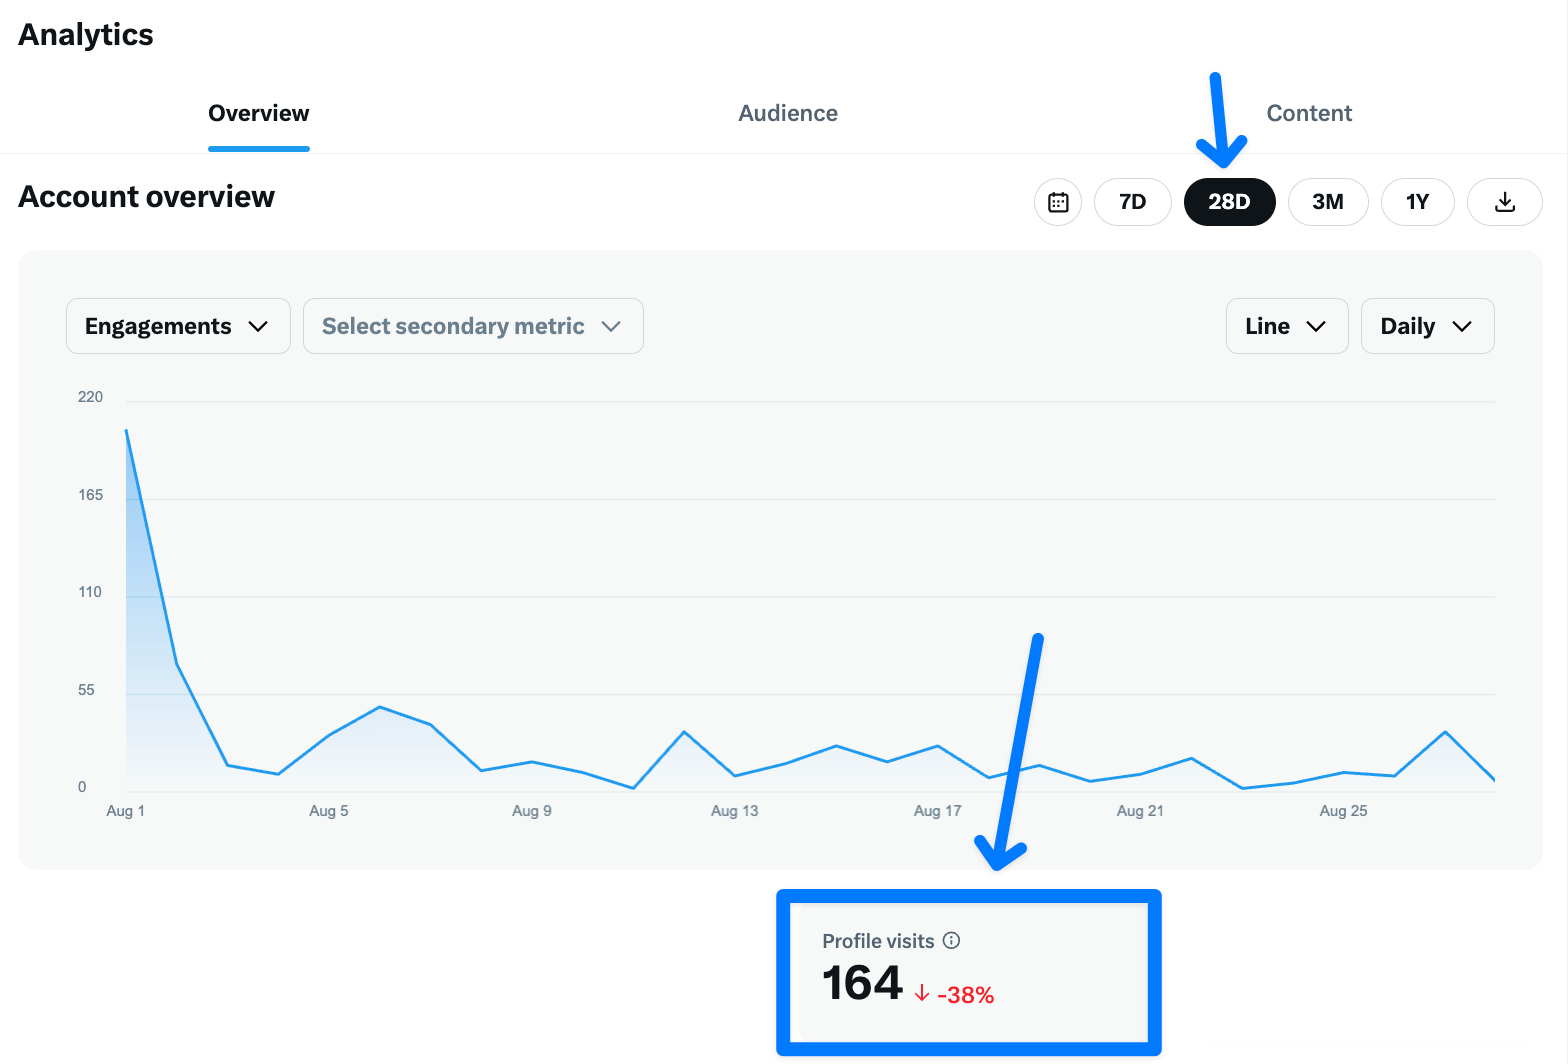
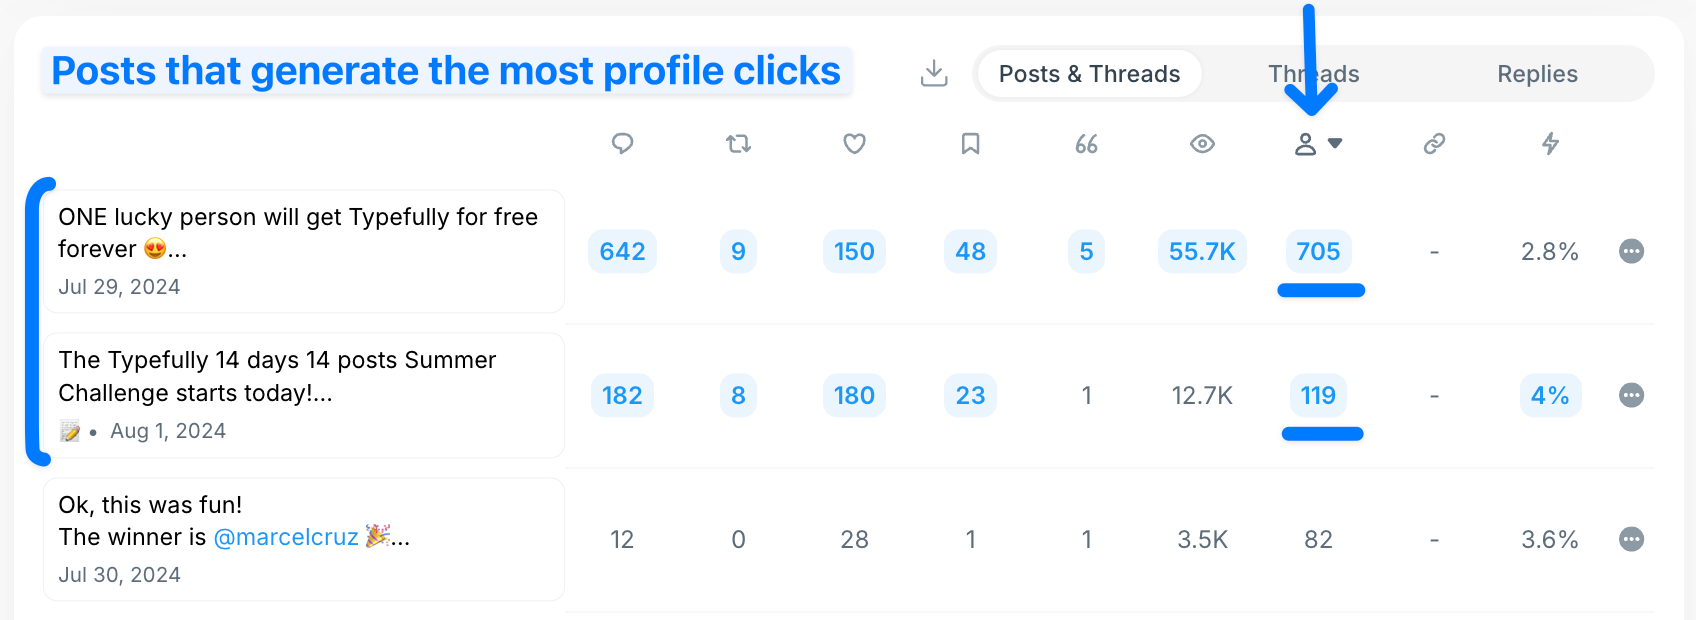
3. Profile visits
Profile visit refers to the number of times your X/Twitter profile has actually been seen by people, once or multiple times. It’s a good indicator of engagement but also of interest generations. The more visits you get, the more interested people are in your content, in knowing who you are, what you do and in following you more closely.
This is also easily available in your X/Twitter analytics dashboard.
4. New followers
Ok, very important metric about your X/Twitter growth. This tells you how many new people have started following in any given period (e.g. last 28 days). It’s a very good indicator of how well you are performing in terms of providing value (people only follow people whose content they like) and in terms of reach (if people don’t hear about you, they can’t follow you).
It’s a key metric to keep an eye on but don’t worry too much about sudden drops as X/Twitter does regular cleanups of bot and spam accounts. The quality of new followers also matter massively.
You can analyze this growth easier in Typefully as illustrated in the charts below.
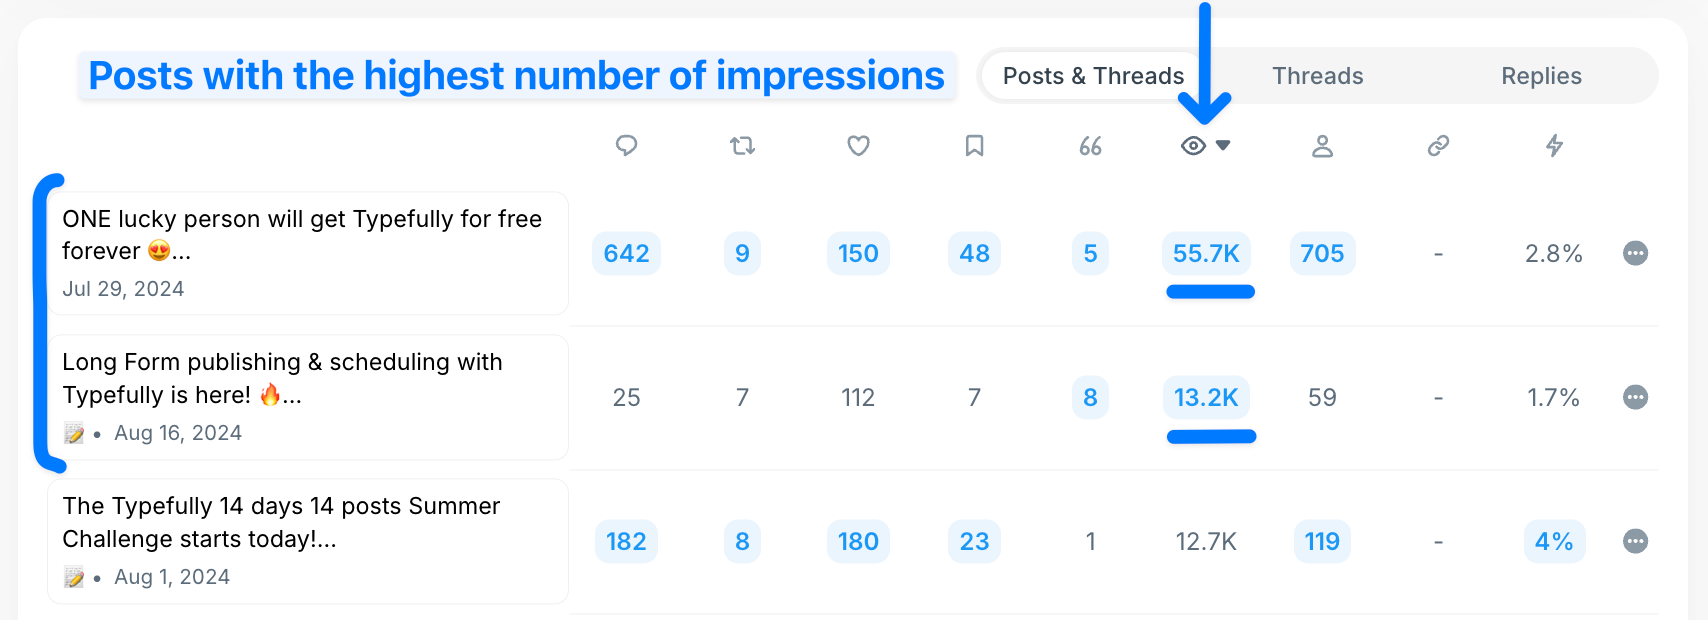
5. Best performing posts/tweets
If you want to know how your content is performing, you should look at each individual post/tweet and understand which ones are delivering the best on the metrics you’re looking for.
What are the posts that reach the most people? Which ones get more engagement? Which ones convert more people into followers?
Understanding this is critical to find patterns and double down on your best performing content. Fortunately, this is super easy to do in Typefully too (not so much on X/Twitter Analytics native dashboard).
The top 5 X (Twitter) analytics tools for 2024
This list is specific to X / Twitter analytics tools, but we’ve also got a list of the best Twitter growth tools here if you are interested.
1. Typefully
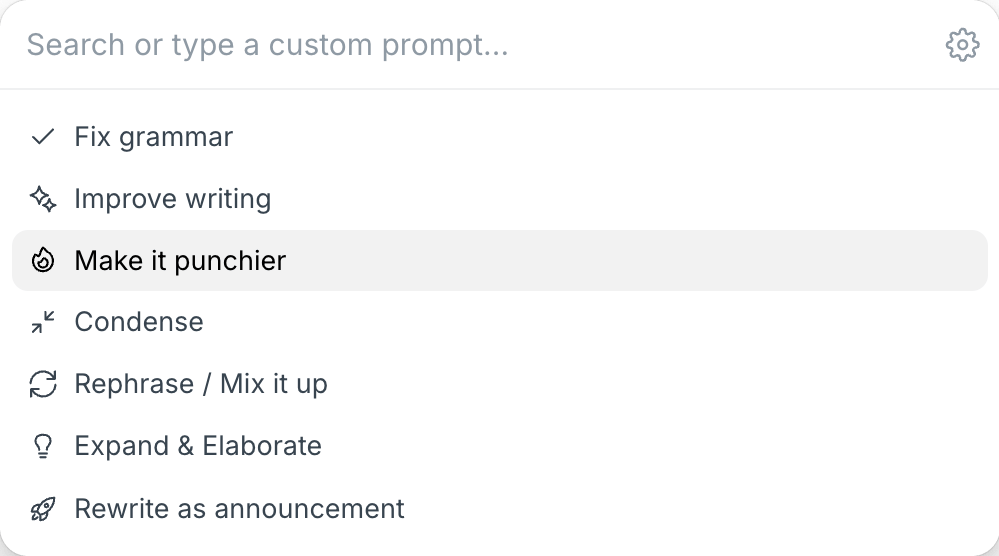
Typefully is a complete tool to manage your X / Twitter content creation, scheduling and analytics, allowing you to use its AI-writing assistant and cross-publish the content onto other platforms with a single click.
It’s suitable for all types of users, from solopreneurs and founders, to content creators, marketers and larger content marketing teams.

2. X / Twitter’s own built-in analytics
The analytics dashboard that X (Twitter) offers is basic but it works for beginner and intermediate users. It has all key metrics and historical data you’ll need if you are just starting out.
The main drawback is that is not easily accessible or visible, it requires a lot of manual work to analyze the metrics and the data is limited if you are not a X Premium user.
3. Later
Although not a tool built originally for X/Twitter (it started as an Instagram only scheduling tool), Later now also offers integrations to Facebook, X (Twitter), LinkedIn, TikTok, and Pinterest.
It lets you monitor trends in your overall performance, like weekly and monthly growth, and click tracking.

4. Metricool
Branded as the “digital Swiss Army Knife for social media managers”, Metricool offer a variety of solutions including the ability to create X/Twitter analytics reports.
5. Zoho Analytics
Zoho is a quite big company with a wide set of products from HR management to CRM solutions, including Zoho Analytics which supportx X/Twitter Analytics.
Optimizing The Use of X (Twitter) Analytics Tools
To maximize the benefits of X (Twitter) analytics tools, implement the following best practices:
Regularly analyze your performance
While X/Twitter analytics tools streamline data collection and visualization, it’s still up to you to do the interpretation and analysis. Only you know your content and audience. So make sure sure you conduct monthly reviews to:
- Identify content trends and patterns
- Analyze your audience engagement
- Monitor the growth/decline of key metrics
Keep an eye on what competitors are doing
Don’t copy exactly what they are doing, you don’t know if it’s working. However, it’s important to be aware of your competitors' activities on social media, compare growth metrics and evaluate the performance of your content against theirs.
Diversify your content and try new things
In order to collect valuable data on your X/Twitter analytics, you should be constantly trying different content and publishing it at different times and days. Diversifying what you put out there is the best way to know what works and what doesn’t.
Conclusion
X/Twitter analytics is an indispensable tool for anyone looking to grow their online presence and optimize their social media strategy. By regularly monitoring key metrics such as impressions, engagement rate, profile visits, new followers, and best-performing posts, you can gain valuable insights into your audience's preferences and behavior.
Whether you choose to use X/Twitter's native analytics dashboard or opt for third-party tools like Typefully, the key to success lies in consistent analysis and adaptation of your content strategy.
Remember, the goal isn't just to grow the numbers, but to create meaningful connections with your audience and drive real business results. As you continue to refine your approach based on these analytics, you'll be well-positioned to maximize your impact on X/Twitter and achieve your social media goals.


Discover
Join 10,000+ customers to grow on 𝕏, LinkedIn, Bluesky and Threads.
Level up your content with AI and boost engagement 🚀
Join 10,000+ customers