I wanted to briefly go into how I created a Lego-style map of Canada... The map basically consists of multiple layers of the point grid (created in @QGIS) & visualized as squares/circles in @TableauPublic.
Let's get started... #RandomQGIStoTableauStuff #16 🧵
twitter.com/professorkao/status/1707909033837867393?s=20
I've posted about creating grids in a previous thread & it's the same process...
In this case, I need a point grid layer w/ points that intersect & contain the information from the target geography (i.e. Canada & its provinces)
First step, of course, create a grid...
twitter.com/professorkao/status/1630294479126122497?s=20
Next, use the Select by Location tool to select the points that intersect w/ the target geography. Copy & paste selected features as a temporary layer...
...then use the Join Attributes by Location tool to join the provincial info from the Canada layer to the point grid.
Save the Joined Layer as a shapefile ("Point Grid")
Note: In this case, Prince Edward Island - due to its size & the spacing of points - was missed. You can also use the Select Features tool to manually add features to the current selection (by clicking & holding the Shift key).
For a drop shadow effect, use the Geodesic Transformations tool (Shape Tools plugin) to create a layer w/ the points moved slightly to the desired position (e.g. 10 km at 225 degrees from the original points).
Save the new Transformed Layer as a 2nd shapefile ("Drop Shadow")
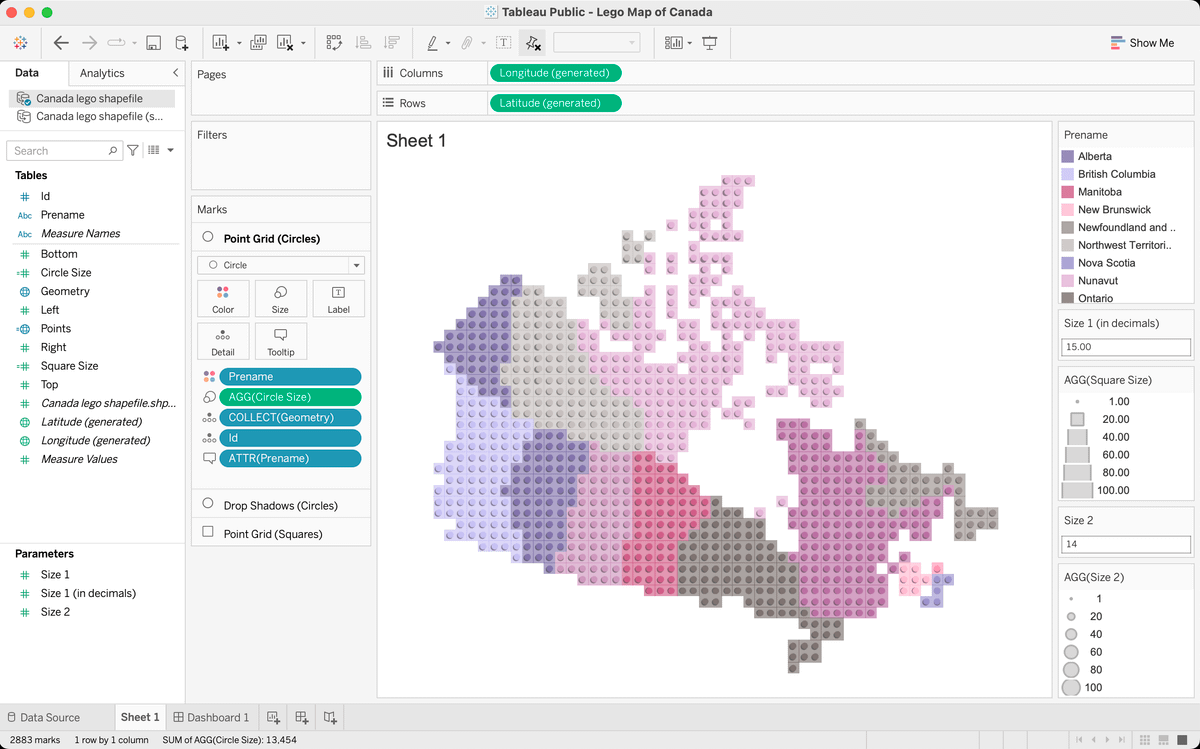
In @TableauPublic, pull in both files & create the map w/ the following layers:
Grid (circles)
Drop Shadow (circles)
Grid (squares)
Define colors (e.g. by province) & opacity
Adjust size as desired (Note: I used parameters to get the sizes just right)
Cheers! 🙏