The thoughts in the quoted thread ruffled some feathers, so let's do a quick observability 101.
Alternative title: "how to not get abused by your logging/ monitoring/ o11y vendor"
A 30-tweet thread cause I am trying to micro-blog 👇
twitter.com/iamvlaaaaaaad/status/1543892406969442304
If you speak Romanian, I already gave a talk on this topic at Bucharest's Cloud Native Meetup in September 2021! See this video, starting at 51:05: youtu.be/XFP1-45ZL08?t=3065
Watch that instead, as this thread is an English re-cap of that talk!
First, what is observability? AKA o11y cause nerds love their acronyms.
Quick spiritual answer: it's knowing what your apps are doing! How do you know if feature X works? How do you know if and why feature Y fails?
Actually helpful answer, but kinda wrong: logs, but better.
As developers, if we want to know something happened, we log! We've all been doing this since the first "Hello world", to the fabulous "got to here" and "safafqwebvqeb".
Since this is Twitter, I'll skip ahead: we evolved to do structured logging.
They're still logs, but with extra data and searchable: if you search for `payment` you get like 500 results, if you search for `payment.execution` you get 1.
We've been doing this since like 2008!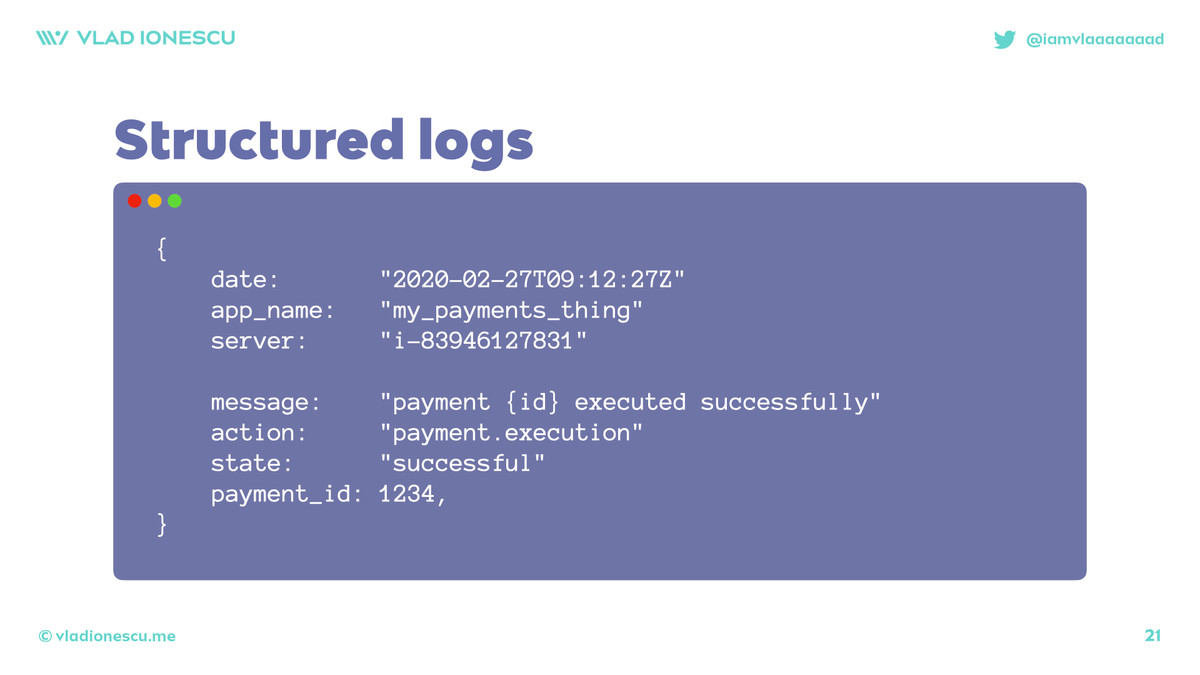
Some folks had the great idea of adding `transaction-id` or something like that so you can track an action from the absolute start to the absolute end.
Waaaay easier debugging!
As an industry we stayed here for a while. It was pretty nice!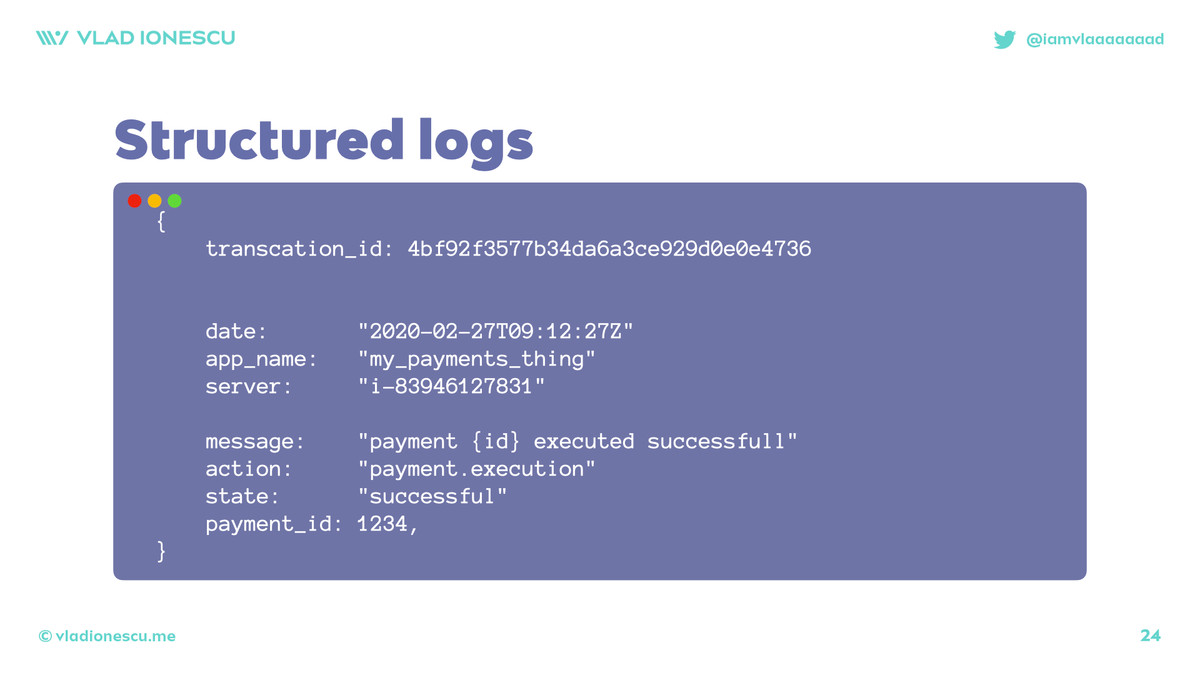
It wasn't great tho cause we could see all the logs for a flow easily, but damn do some folks log 99999 lines.
We added a `sub-transcation-id` to the logs!
Say each department gets a mini-thing you can hide, eg for payments, maybe its the tax calculation that's logging a lot.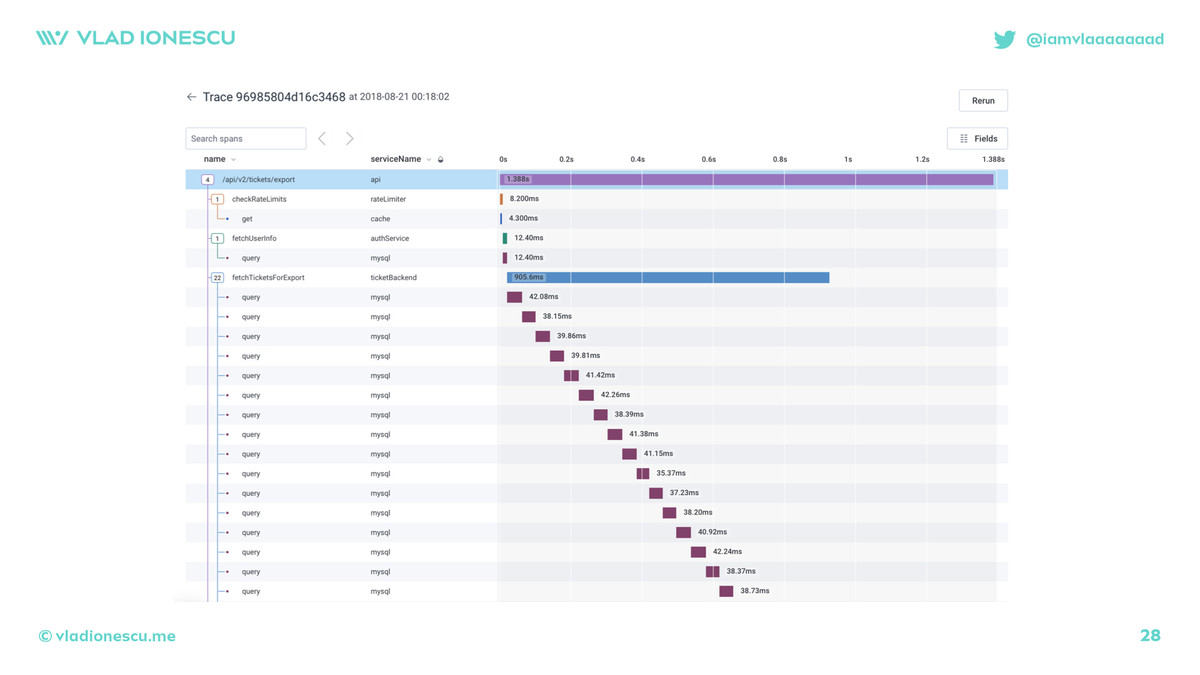
That's tracing! Literally!
Tracing is not something new or revolutionary or something we should be scared of. We've been doing a lighter version of tracing with logs since the first "hello world"!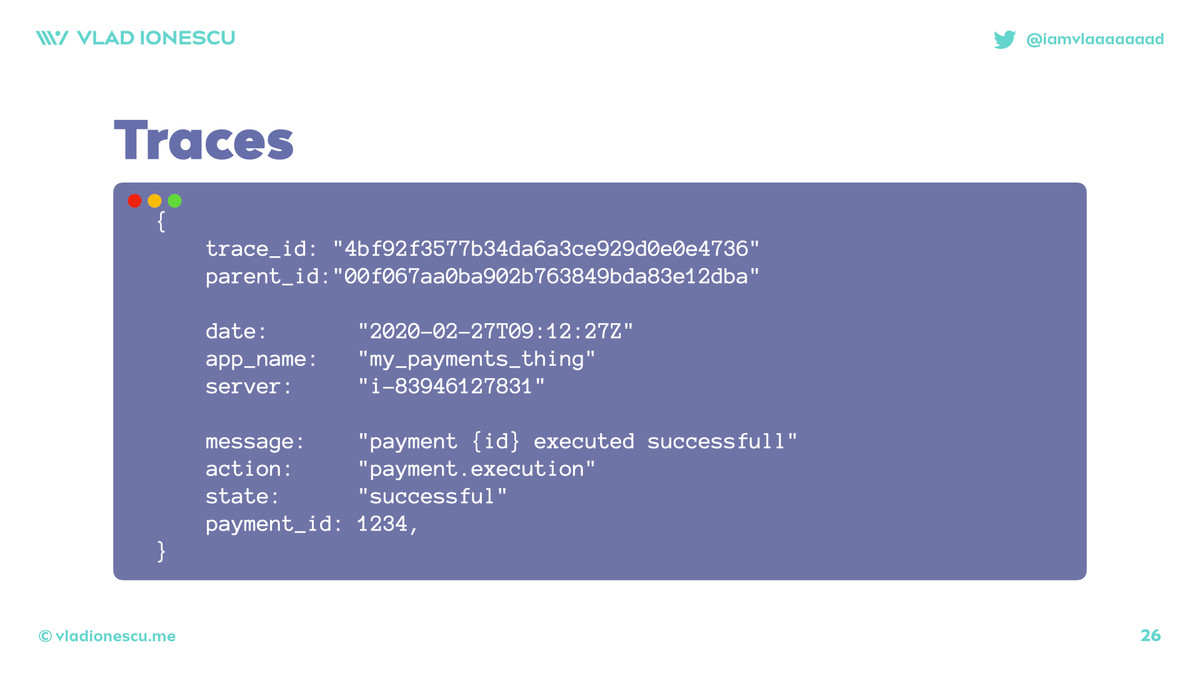
APIs changed a bit, SDKs changed names, and we invented new terms (`trace`, `span`, and `baggage`) but it's the same thing!
Each relevant operation is emitting details about what's happening!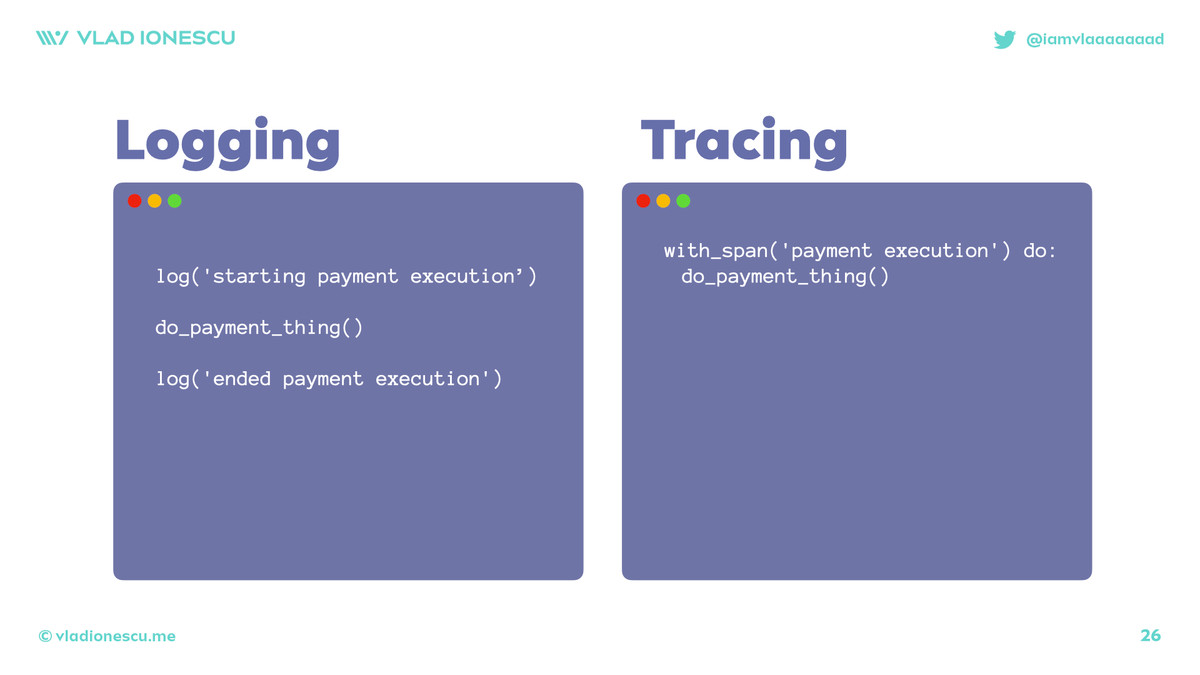
Aside: logs won't go away! Access logs, audit logs, security logs, and so on will remain a thing.
But logs should never be used by developers or support when investigating issues!
Now, W3C actually wrote a formal specification for this! How the fields look, what their names are, how they get sent over the internet, how they get encoded, and so on.
This, kinda like say the HTTP spec, meant that EVERYBODY quickly standardized on this: OpenTelemetry.
With OpenTelemetry all the instrumentation/ monkey-patching/ data collection is done in a consistent way, by everybody.
That means, among others, 2 things:
1) a single high-quality* instrumentation library
2) easier o11y vendor adoption and migration
*: WIP, depends on language
No more DataDog has the best SDK for Rails, NewRelic is the best for .NET, and Splunk is the best for Spring!
No more 30 teams working on the same thing and duplicating effort.
OpenTelemetry unified all those efforts in a single high-quality* SDK!
*: WIP, depends on language
No more more "we can't try vendor X cause we have to change a ton of code"!
With OpenTelemetry you can send data to all the vendors you want! When the SDK is initialized you say who the data is sent to.
Want to send to another vendor too or change vendors? 1-line change.
OpenTelemetry eliminated all the differentiation in how observability data is collected 🎉
Everybody has top-notch instrumentation, so vendors differentiate themselves on features now!
Everybody collects the same data => what you can actually do with the data matters now!
Aside: there's still a difference in how vendors accept data!
As far as I know, there are only 2 vendors that genuinely help you send them less data (so you end up paying them less) with not-terrible trace-level sampling: Honeycomb and Lightstep.
That's a pretty strong signal!
Now that all vendors get the same data with OpenTelemetry, what matters is what you can actually do with that data!
How can you figure out what is happening with your app?
Getting back to my original thread, observability is asking questions! The more questions you are empowered to ask, the better 🚀
Are you only allowed to ask 3 specific questions? 💩
Do you have to pay some money each time you ask a question? 💩
twitter.com/iamvlaaaaaaad/status/1543892406969442304
But what about open source observability?
Yeah, no. It's a horrible developer experience and it won't get better.
Like Linux on the desktop, feel free to lie to yourself that it's not that bad!
See this Twitter Space for a longer discussion of this:
twitter.com/mhausenblas/status/1544727700383965187
A developer example:
➡️ Can you search for any field in that JSON, or are you only allowed to search for up to 10 felds at a price of 💰 per field?
➡️ Can you visualize each field in that JSON, or are you only allowed to do a search and then manually go through 100s of results?
➡️ Can you ask a question immediately after you send data, or do you have to wait rand(0, 15 minutes) after it's sent?
➡️ Are all queries fast, or is a search on 10k lines waaay slower?
➡️ Can you see all results, or only the top 100 results as determined by... something?
A non-developer example:
➡️ Can you see how many customers are using the new feature you spent 6 months building? Is it performing better or worse than the alternative?
➡️ Can you identify the emails of all customers affeced by the 15-minute incident for app X?
Concrete examples:
➡️ One of you app containers takes rand(10%, 300%) longer to respond than the others. Can you identify that 1 slower k8s pod out of 100?
➡️ The database CPU is high. Can you visualize all the queries sent to the DB to see what's taking most of the time?
More concrete examples:
➡️ This application endopoint is slow sometimes. Can you look over the last 7 days and see where the slowdown is coming from? Is that slowdown matching with any other events in the system?
➡️ WTF WE JUST SCALED 100x WHAT IS HAPPENING?!
Even more concrete examples:
➡️ How many times did we run 'expensive computation' today? What customers did we run those for?
➡️ We have 10k traces, each with 3000 spans. How fast can I find the 1 trace that is weirder than the rest? What about seeing the spans with errors?
... and so on and so forth.
It's amazing how many questions people start asking when they realize they are allowed to ask whatever questions they want!
And by asking questions, we learn! And by learning we're building better, more efficient, and more reliable systems!
TL;DR 1/3:
All vendors get the same data now, so:
- instrument your code with OpenTelemetry
- "magic" instrumentation is like automated code docs: terrible. Add business and developer context, not "this is a loop" comments
TL;DR 2/3:
With all vendors getting the same data in, it's ALL about what you can do with the data and how many questions you can ask!
How many questions you can ask, how you're billed for them, and how good is the experience is how you should measure o11y vendors!
TL;DR 3/3:
Got some time to invest in proper observability? Honeycomb. They're literally years ahead.
Got no time to invest? Datadog. As much as I criticize them, they offer a nice, unidfied experience. It's expensive, unified 💩 , but it's better than expensive, scattered 💩!