Plotly is the powerful data visualization library data scientist can explore to communicate insights✅
Let's look at the plotly code example to visualize the teaching and research scores of top universities to get a better understanding🧵👇
1/ First of all, we will load the dataset of world university rankings in the kaggle environment or you can download it if you are using the local environment.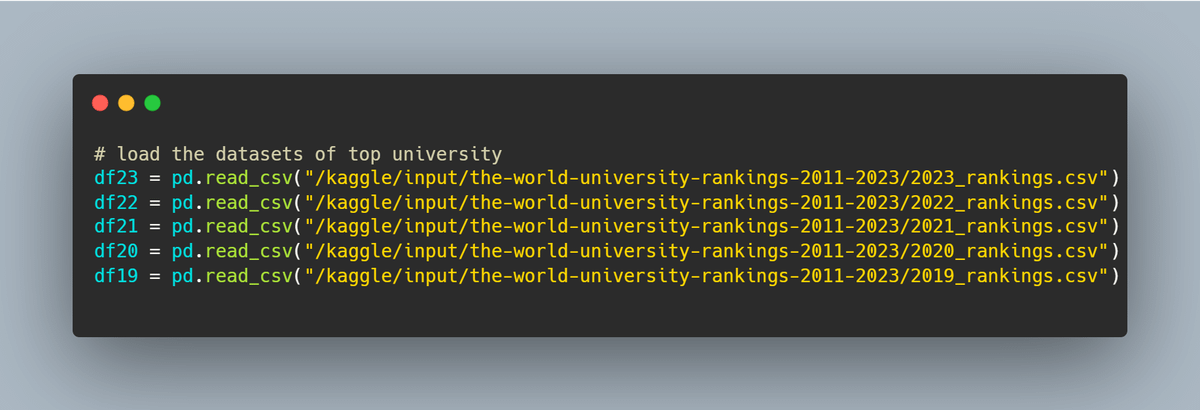
2/ Wrangle the dataset to convert it into our target dataframe with x and y-axis columns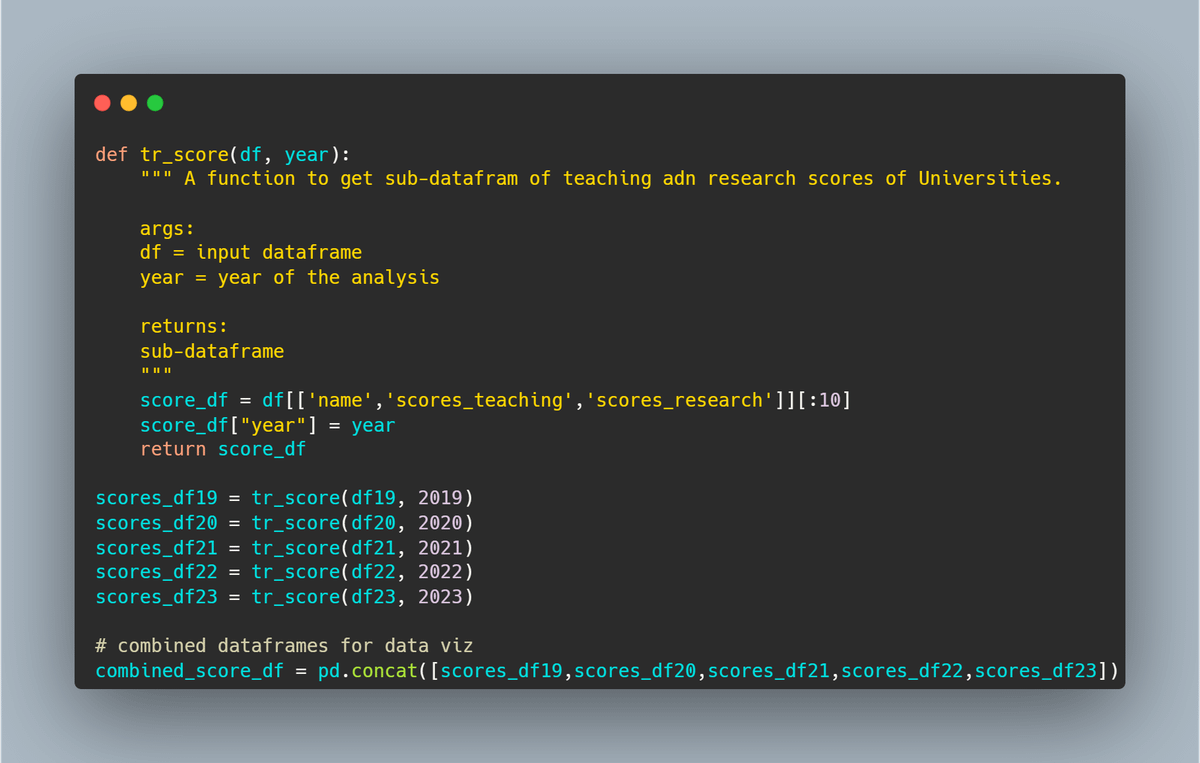
3/ Write the plotly code to plot the line chart of university teaching and research scores over a period of the last 5 years.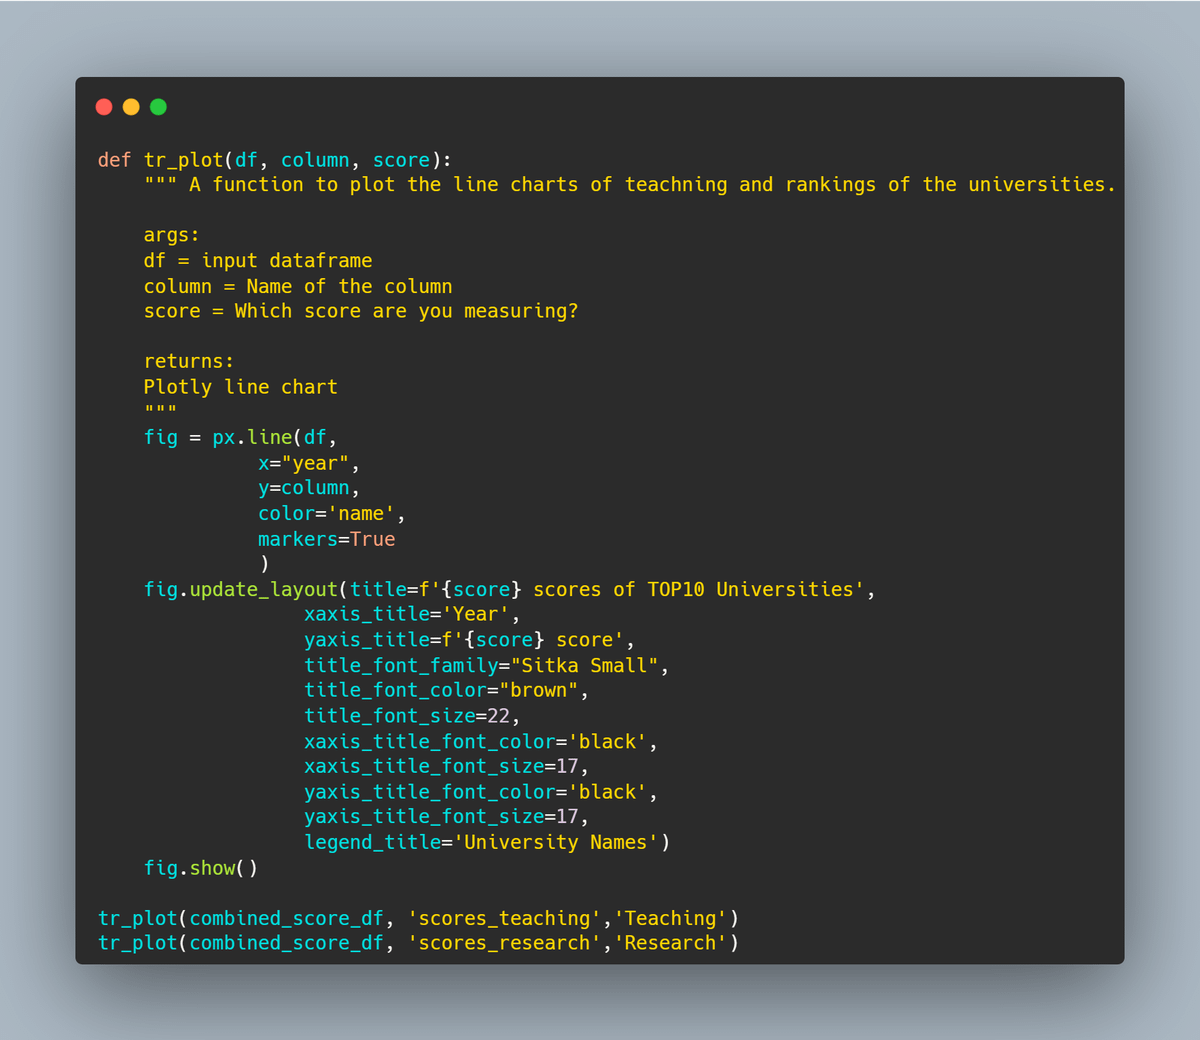
Hurrah! output is here👇
Teaching scores of the Top10 universities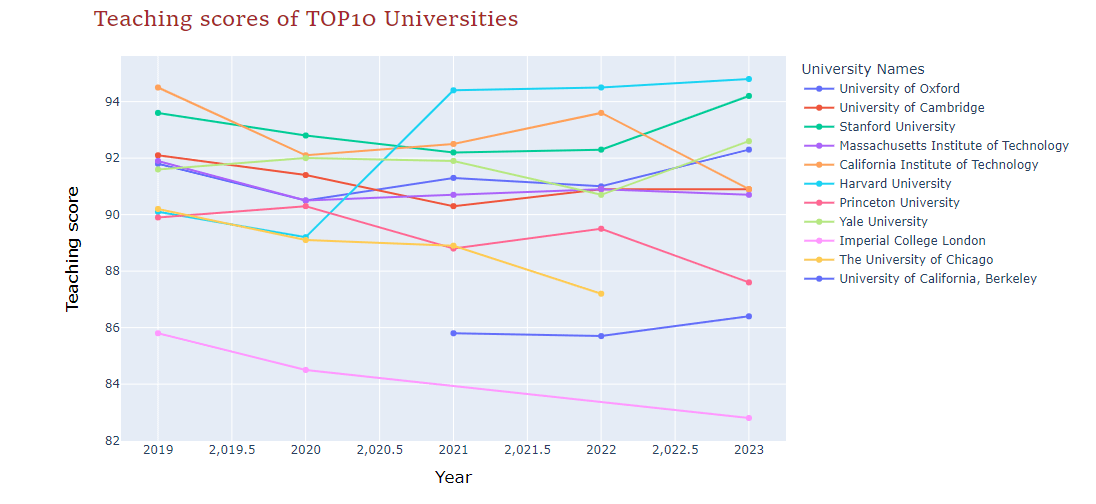
Research scores of Top10 universities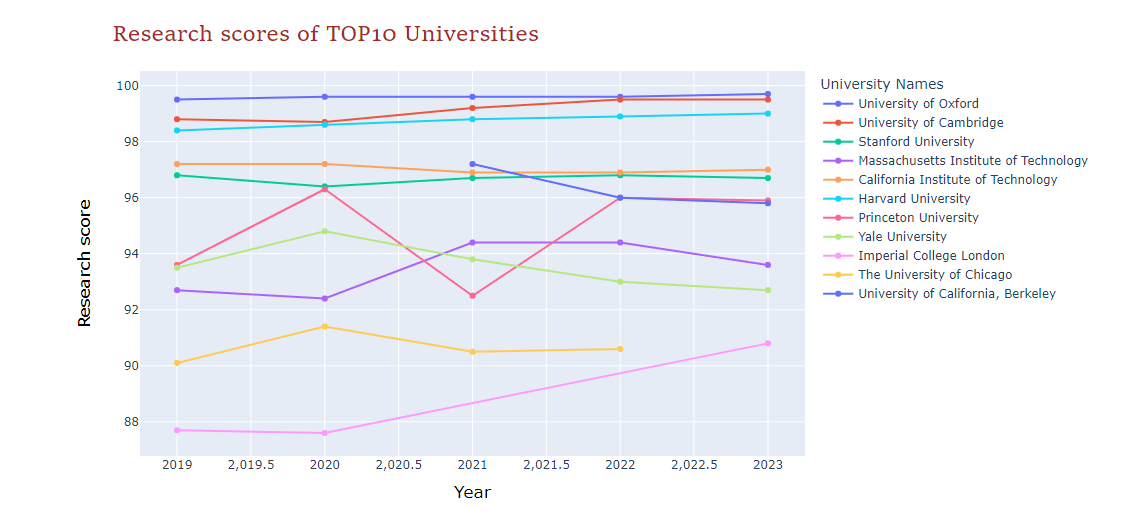

Avi Kumar Talaviya
@avikumart_
Simplifying Data Science and Machine learning for beginners🤖 I share valuable threads & resources on DS/ML/DL @kaggle Master|Python|ML|Data|Analytics|Tech