🧵
What makes traders fail isn't what they know, but rather what they don't know.
There is no doubt that the financial markets are highly manipulated, but few people know how this occurs.
Today, I'll give a piece of the puzzle:
In this thread, I will cover:
・Refresher of some concepts I've covered previously
・How buy-side & sell-side liquidity has been engineered in $ETH
・Where the Draw on Liquidity for $ETH is in the coming days
・Proof of Concept
・An opportunity for you to delve deeper with me
Refresher
__
If you aren't familiar with the idea of sell-side liquidity, I'd advise you to familiarise yourself with the idea by skimming through this thread.
I covered sell-side liquidity there, now I'll cover buy-side liquidity.
twitter.com/JiraiyaReal/status/1530574970903875590?s=20&t=XIn-ZQpCJ5S7XqaclIaJOQ
Buy-Side Liquidity
__
When referring to buy-side liquidity, I refer to buy stops & stop losses of shorts.
When these orders are triggered, traders will take on a long position (buy) and lower-level shorts are forced to cover their position (by buying).
When this occurs, it facilitates the opportunity for another party to act as the counter-party.
You are willing to buy X at Y price. Someone is willing to sell you X at Y price.
Are you following so far? Simple, right? Great!
So, where does buy-side liquidity reside?
Oftentimes, buy-side liquidity will be found above Old Highs.
This is where breakout traders will place their buy stops in anticipation of price breaking to the upside.
Simultaneously, this is where traders will place their stop losses when they go short.
How buy-side & sell-side liquidity has been engineered in $ETH
__
The chart I've attached below is Ethereum on the H4 Timeframe.
Look towards the left and note the highest high, and the lowest low that you can see then mark it out.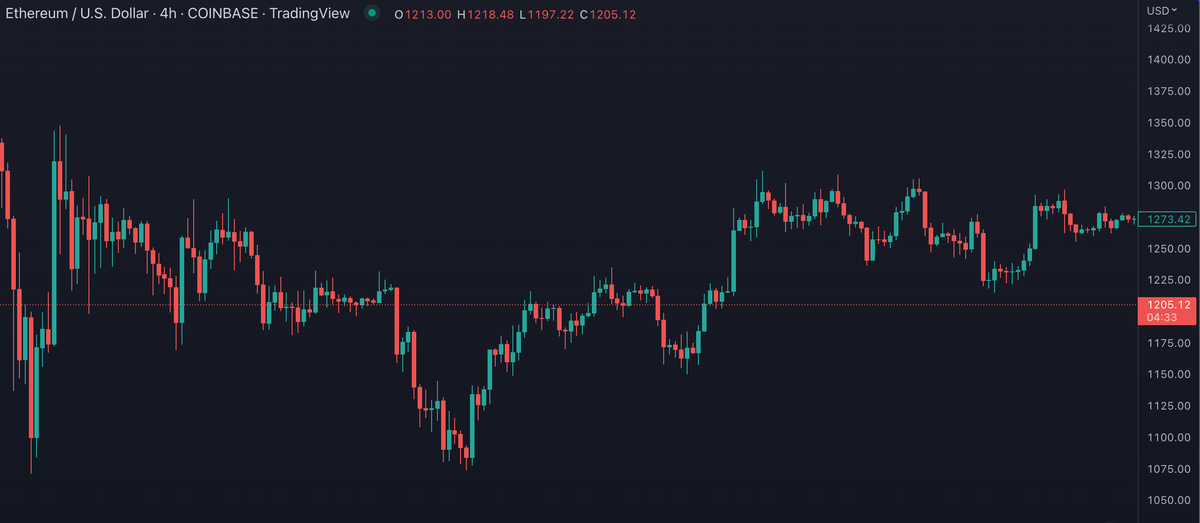
It should look like this.
$1347 is your buy-side liquidity level.
There will be breakout traders that expect price to rally higher if this high is taken. Simultaneously, this is where those who have went short would have placed their stop losses (if they're extra conservative).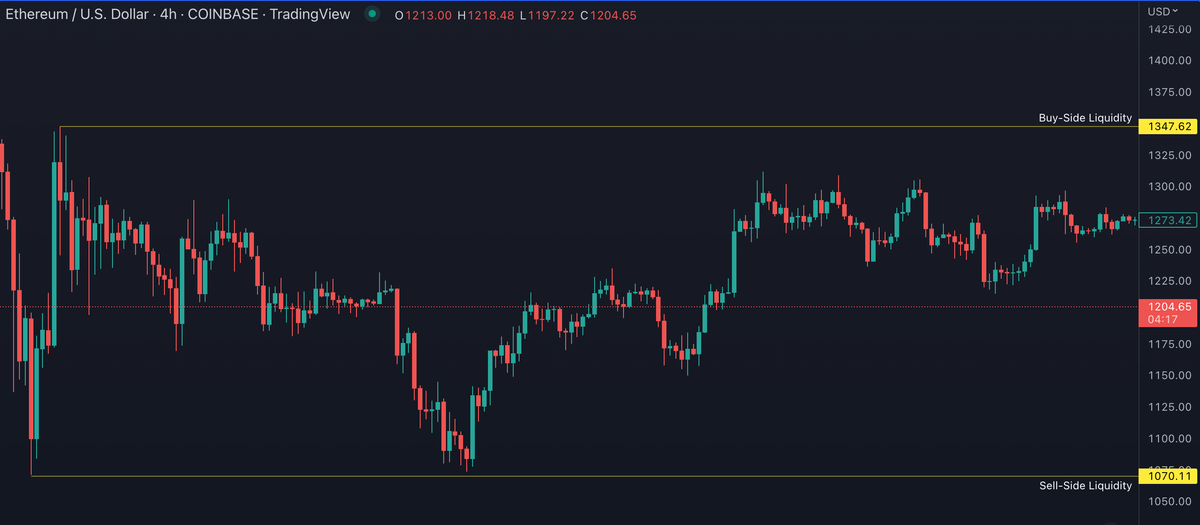
$1070 is your sell-side liquidity level.
There are sell-stops placed below in the form of traders that anticipate a breakout to the downside, and stop losses of traders who went long seeing the lows as a "Double Bottom" (Retail Perceived Pattern).
If the Higher Timeframe Orderflow is Bearish, then by aligning these technical levels, I would assume that buy-side liquidity must be swept first prior to the decline towards the sell-side liquidity.
Why?
By pushing price into buy-side, an influx of buyers enter the market.
This offers Smart Money the opportunity to sell into those orders, building shorts at Premium Price Levels.
To profit from a short, they must buy it back at a lower price level.
They can only buy (with size) where there are willing sellers.
Where are there willing sellers? 🤔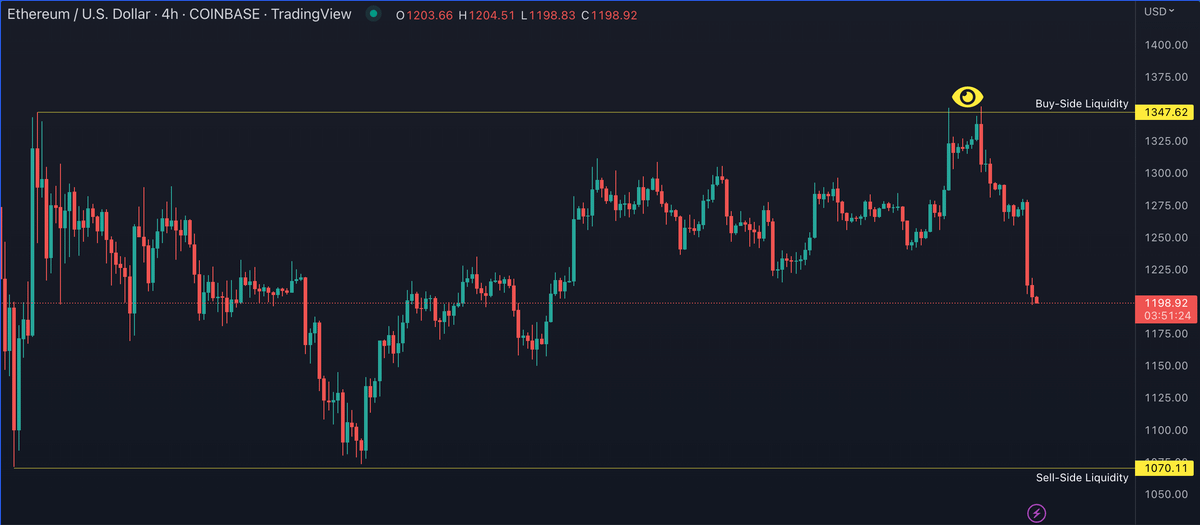
If you said "Below Sell-Side Liquidity" or "$1070" then you're right.
I'm glad you've paid attention so far.
Anyone who went long between these price levels would have placed their stops under the intermediate lows, or $1070 if they're extremely conservative.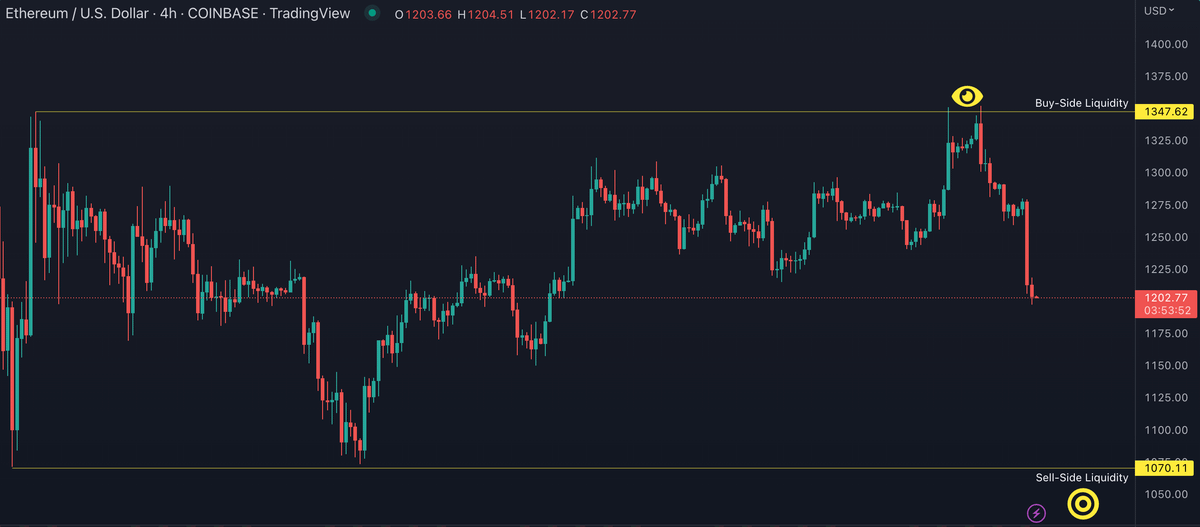
Where is the Draw on Liquidity for $ETH in the coming days?
__
$1148, followed by $1070, followed by $1000.
"Why?" You already know. Because there's sell-side liquidity resting below these lows.
"But, what about $1000? Is that just a random level you called out?"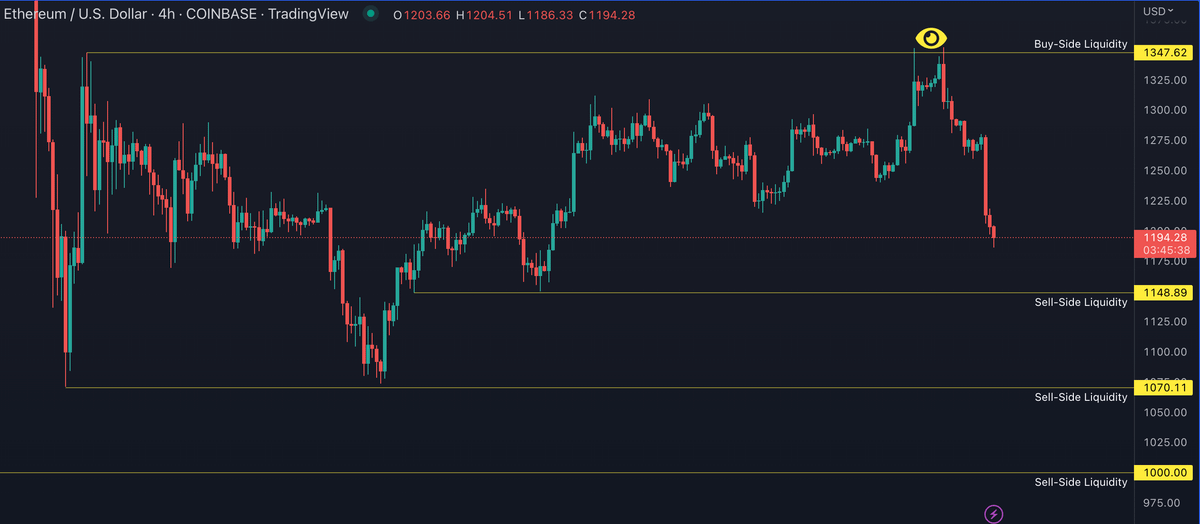
ETH, 1D.
__
Look to the left...
At $1000 there is a set of lows, which will act as a Draw on Liquidity.
That's where I'm ultimately expecting price to sell down into.
I may be wrong, successful trading requires you to be nimble, flexible, and humble.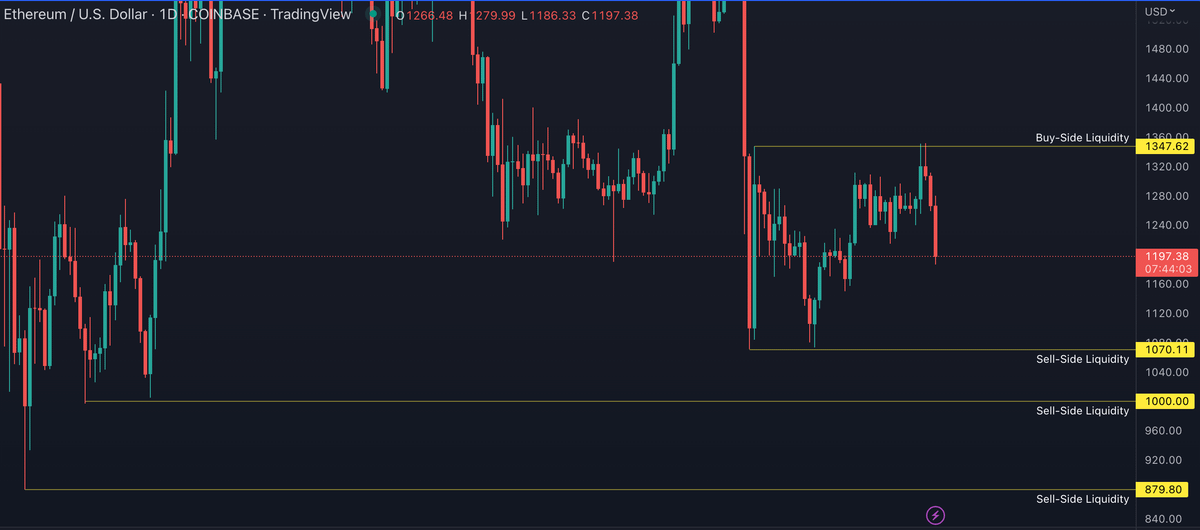
Proof of Concept
__
I showcase proof because many will have doubts. I would too, given that much of the "Technical Analysis" on Twitter is just big accounts LARPing and calling prices in both directions. So, obviously, they will get one right and showcase that.
So, here goes:
I called this potential move to my Mentorship Group last weekend, again just prior to FOMC + stated it on Twitter on Tuesday.
twitter.com/JiraiyaReal/status/1602648158844387329?s=20&t=uyU-qD4eUxaQlBHI-y8CKg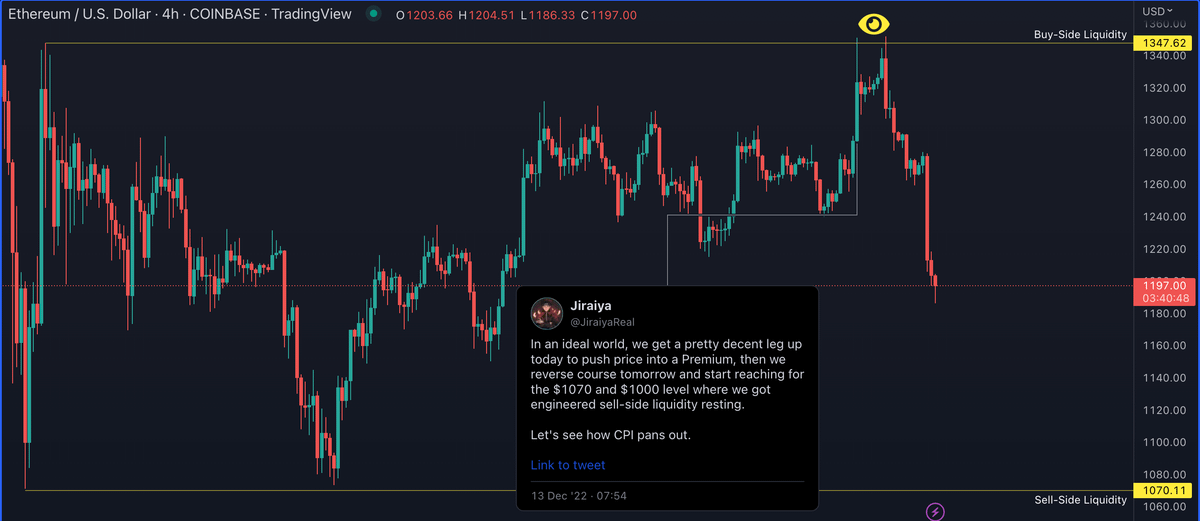
On November 24th, almost 1 month ago, I made a call for a rally up to $1070 also.
twitter.com/JiraiyaReal/status/1595654676766392320?s=20&t=4V-lyj-9jmex_aNcpWUK8A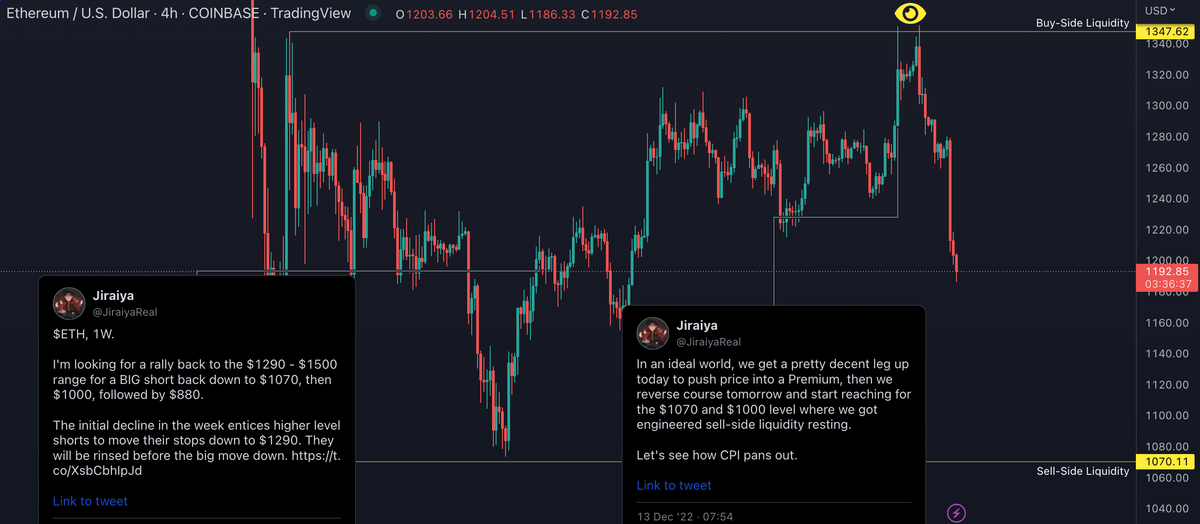
On October 10th, I called for a rally up to $20500 on $BTC using the same concepts I explained above.
Above those highs resides buy-side liquidity. After tagging the buy-side, price reverses to tag sell-side liquidity several days later.
The list goes on..
twitter.com/JiraiyaReal/status/1584977493458845696?s=20&t=XIn-ZQpCJ5S7XqaclIaJOQ
This was only one piece of the puzzle, but I hope you found it insightful.
If you resonate with the logic that underpins these concepts & wish to learn more, I'll be hosting my 4th Technical Analysis Bootcamp in Jan 2023.
Here are some testimonials of my previous mentees:
twitter.com/JiraiyaReal/status/1573945924094599168?s=20&t=69dVvsrYI1D_jmft-5Ex4w
In a few days, I'll be opening up 20/50 spots for the Bootcamp in January, it will be first-come, first-serve.
Comment on the first post of this thread if you are interested in learning more about the course.
I'll DM you shortly.

Jiraiya
@JiraiyaReal
Founder @TailoredWeb3 | Supporting @SolvProtocol, @ionet, @Puffpaw_xyz, @NillionNetwork, @Infinit_Labs | We helped teams raise $75m+ | @imperialcollege Alumni