
You can use the standard normal distribution to calculate probability.
How?
Let me explain.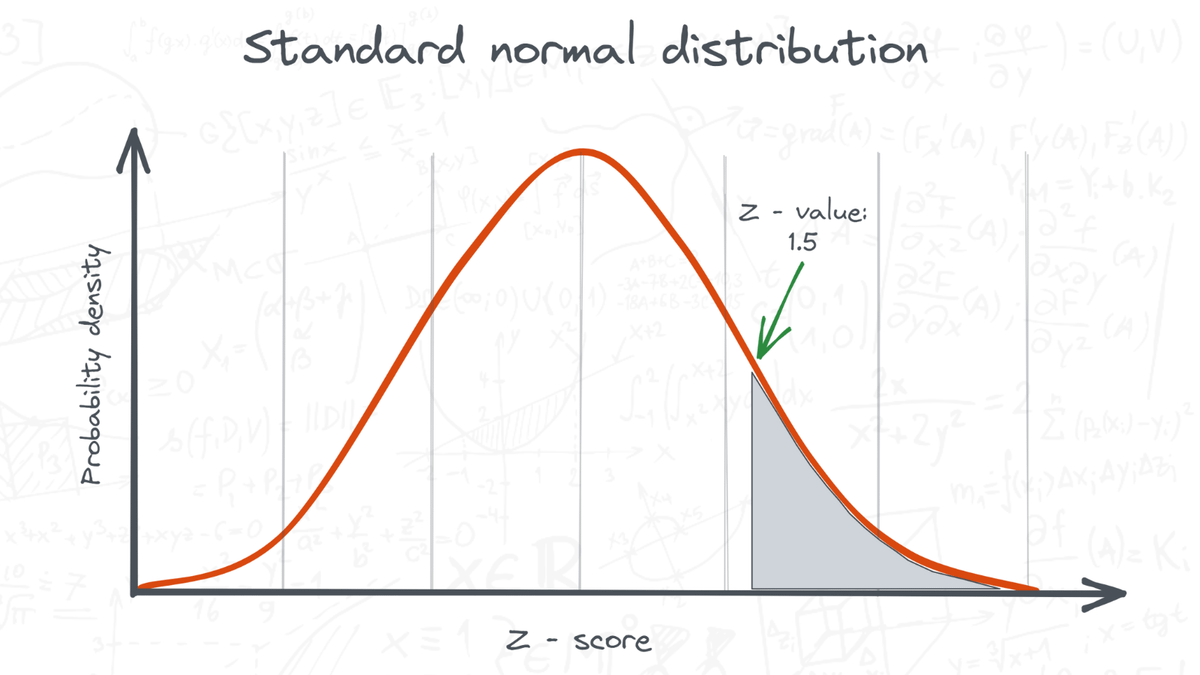
Yesterday we looked at the standardization process and how to calculate the z-value.
Here is the thread:
twitter.com/levikul09/status/1638122032880828416?s=20
The standard normal distribution is a probability distribution.
What is that?
In this distribution, the number of times a value occurs in a sample is determined by its probability of occurrence.
The higher the probability, the higher the frequency.
Here is an example:
The height of people follows a normal distribution with mean 175 cm.
The values are 'centered' around the 175 cm value.
If you randomly select a person, the probability of selecting a person with 176 cm is higher than selecting a person with 200 cm.
The total area under the curve is 1 or 100%.
Once you have a z score, you can look up the corresponding probability in a z table.
The table tells you the area under the curve below your z score.
The find the area above the z score you simply subtract the value from 1.
Too much information?
Here is an example:
- You have a normally distributed sample
- Mean = 50
- Standard deviation = 10
You want to find the probability of observing a value less than or equal to 60.
1. Standardize this value by calculating (60 - 50) / 10 = 1
2. Look up the value in the z-table.
The value for 1 is 0.8413.
This means that the probability of observing a value less than or equal to 60 is roughly 84%.
The probability of observing a value greater than a given value is equal to 1 minus the probability of observing a value less than or equal to that value.
The probability of observing a value greater than 60 than will be:
1 - 0.8413 = 0.1587 so roughly 16%.