
Plotting Subplots in Matplotlib 📈📉
• One of the handiest ways to plot multiple charts in matplotlib I find is using the subplot() method.
• It can be used with matplotlib as well as seaborn plots just as well.
Let's see how to use it ↓
• First, calculate the total plots you want.
• Then we decided what grid we want, the numbers have to be multiple of the total plots.
• Like for 4 plots we can have 4x1, 2x2, 1x4 grids.
• To plot, initialize the main plot canvas that would have all the subplots using figure() method.
• Add the size you want for the total canvas.
• Then for each plot precede the plot function with the subplot() method.
• The subplot method would take three arguments, the first multiple (rows), the second multiple (columns), and plot no.
• If we want 4 plots, in 1x4, it would be written as subplot(1,4,1), (1,4,2)...
• Individual elements like legend and title would work for preceding plot until next subplot() is encountered.
• We can put the show() method at the end to suppress any intermediate outputs.
Here are some examples of 4 plots in different grid sets.
• Using 1x4 Grid
• Using 2 x 2 Grid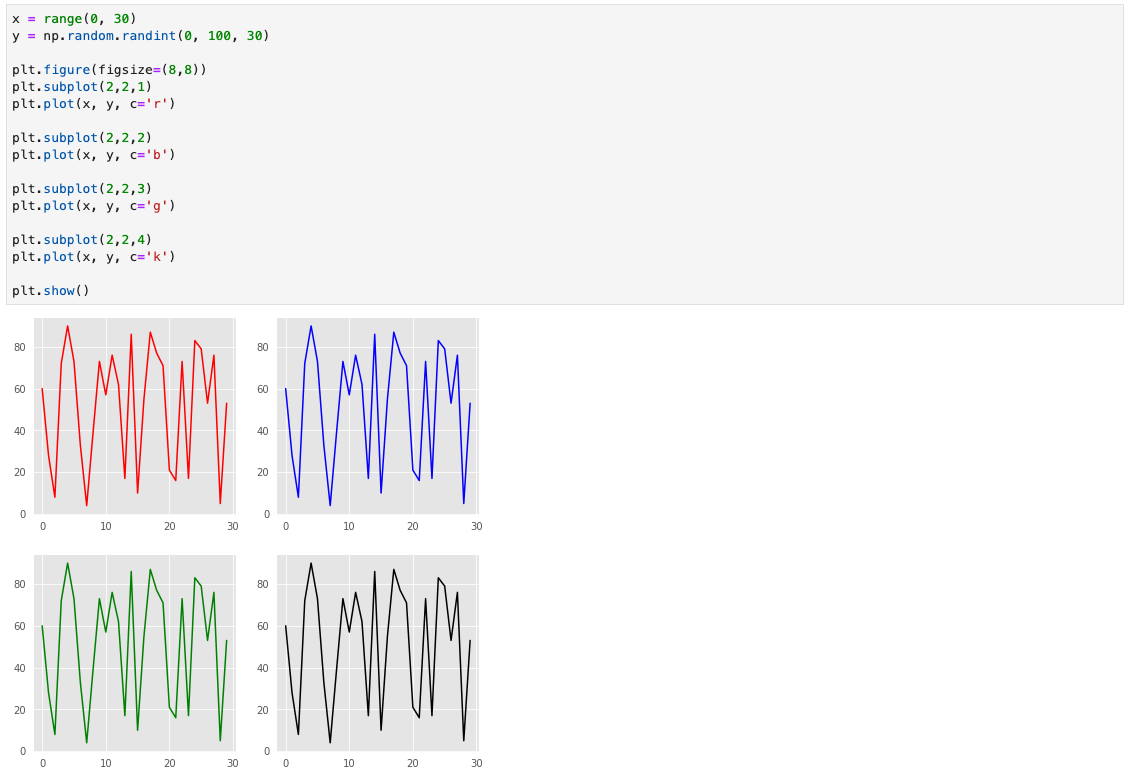
• Using 4x1 Grid
• Keep in mind that you'd need to adjust the figure size as per the grid.
• Like for a 4x1 grid you'd want more height while for 1x4 you'd need more width for better readability.
So that's a quick way to create subplots using matplotlib!
Any comments, suggestions or corrections are welcome.
Thanks for reading!