Part 3️⃣ Exploring Multi Classification Confusion Matrix In Machine Learning
🟢 Generate confusion matrix using sklearn
🔵 Visualize confusion matrix using Seaborn & Matplotlib
🟠 Generate classification report using sklearn
🟡 Derive conclusion on which model does better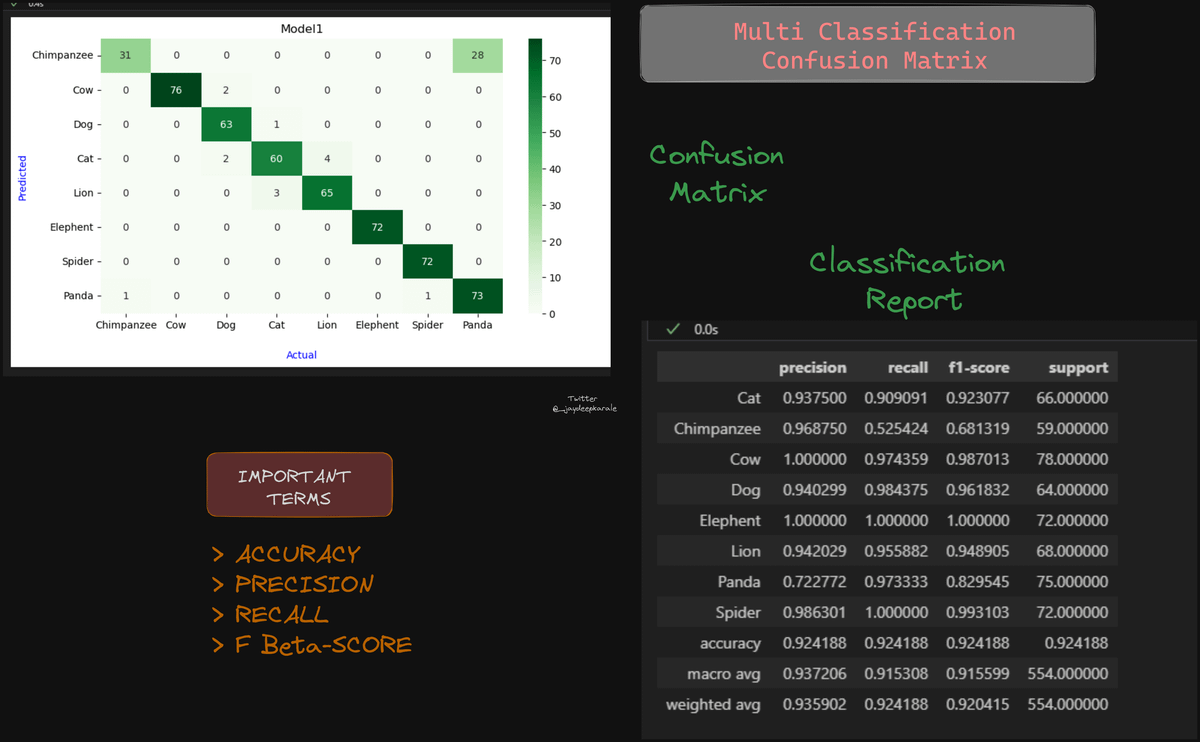
What Is Multi Classification ?
🔵 Classify instances into one of three or more distinct classes or categories.
🟡 Applicable to diverse scenarios such as image recognition, language processing, and medical diagnosis.
How Is It Different From Binary Classification ?
🔵 In Layman's terms we have more than 2 buckets to categorize items into
🟡 As a result simple True Positive, False Positive, True Negative & False Negatives described previously do not apply here
twitter.com/_jaydeepkarale/status/1686000750902829056
🔵 Our dataset to explain Multi Classification are dummy model outputs from 2 models which try to classify animals.
🟡 It contains in one column the actual animal and in another the predicted value by the model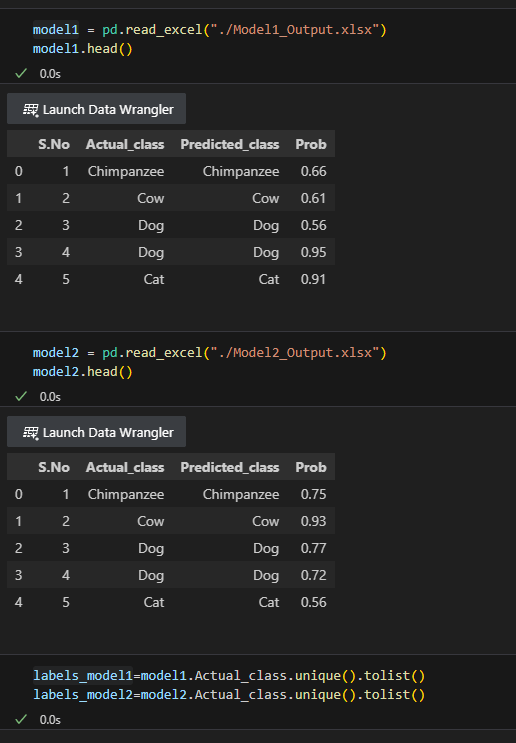
We then use the Seaborn & Matplotlib to plot the confusion matrix as a heatmap.
Some observations we can see
🟢 Model 1 does a better job classifying most animals except 🐼
🔴 Model 2 fares better when classifying 🐼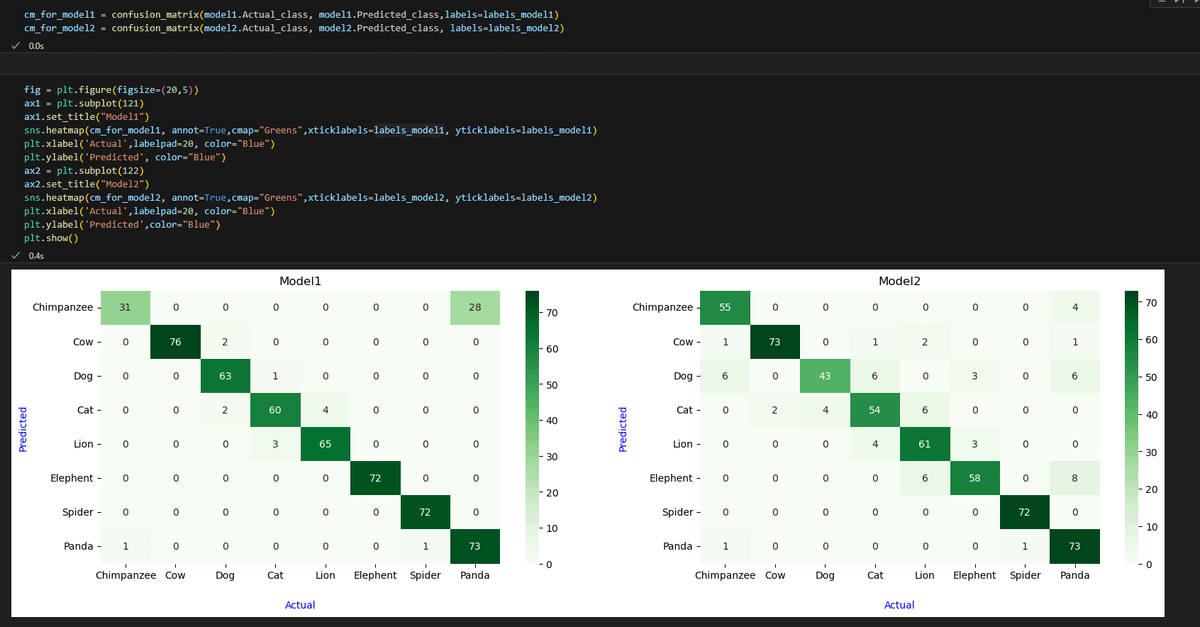
Let's now view the `classification_report` for both models
Some observations we can see
🟢 Model 1 has an overall better accuracy
🟢 Model 2 has better accuracy classifying 🐼
✅ Using an ensemble learning approach combining `Model 1` & `Model 2` (for 🐼 ) may be better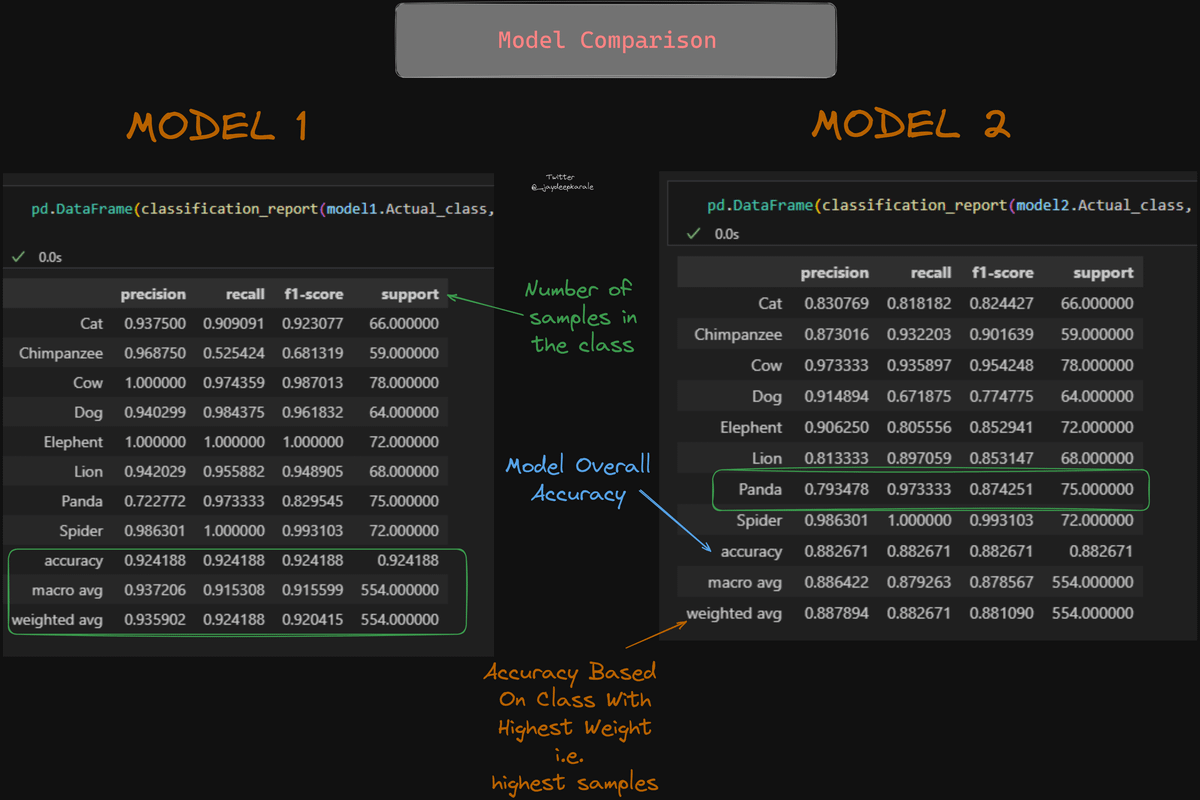
References & dataset courtesy
youtube.com/watch?v=zqJLLaDd4QQ
All Code available on GitHub
It costs you 0 to leave a ⭐ :)
github.com/jaydeepkarale/100DaysOfMachineLearning/blob/main/multiclassification_confusion_matrix.ipynb
Hello 👋
I am Jaydeep from India 🇮🇳
Full time Software Engineer & part time content creator on
🐦Twitter
🖧 Linkedin
🎥YouTube
Follow me for content on
🐍 Python
🤖Ai/ML
🎨Data Visualization
🌟Content creation
Subscribe To My YouTube🔽
youtu.be/FLdS-kBt88M

Jaydeep
@_jaydeepkarale
Follow Me If You Like 🐍 Python 🤖 Machine Learning/AI ⚙️ Software Engineering 📊 Data Visualization 📩 DM For Collab youtube.com/@jaydeepkarale