The latest @BatteryVentures report on Cloud software valuations is out.
It's stunning to see how software valuations have compressed over the past 10-months (chart annotated below)
Some other interesting findings below: 1/13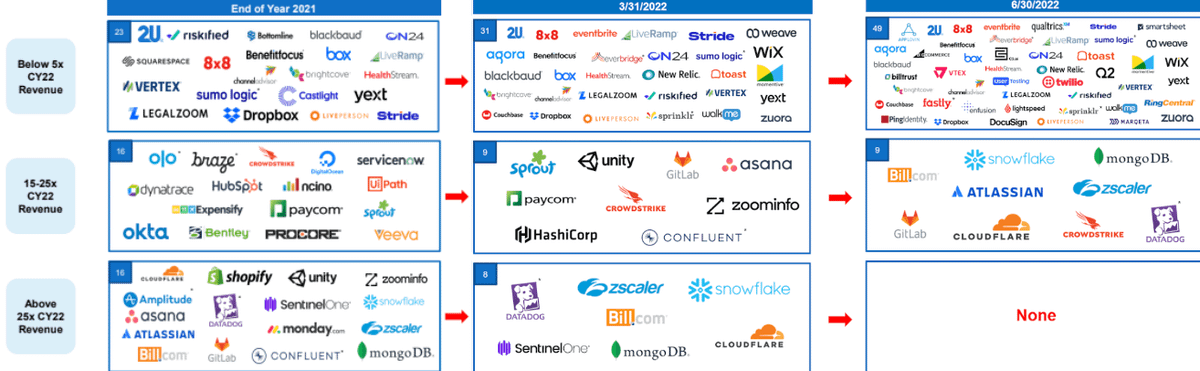
2/ Multiples continue to widen:
- Notice the high-growth bucket
- We went from 20x -> 6x for high-growth cos
- Gap has widened btw the have vs have nots
- Fewer companies in the green zone
The premium for profitable companies (growing by >30%) has increased by 33% over Q1!!
3/ This is another perspective from Guggenheim:
Their chart shows how valuations have compressed, but they break it apart by different sub-sectors in software and time periods.
Quite interesting!
4/ Another interesting finding is that there are more fast-growing companies today than in 2018 & 2020, but this is slowing QoQ.
The number of "take-out" candidates is higher today (<5B) since 2018
It makes me think we haven't seen the Top for acquisitions + take privates by PE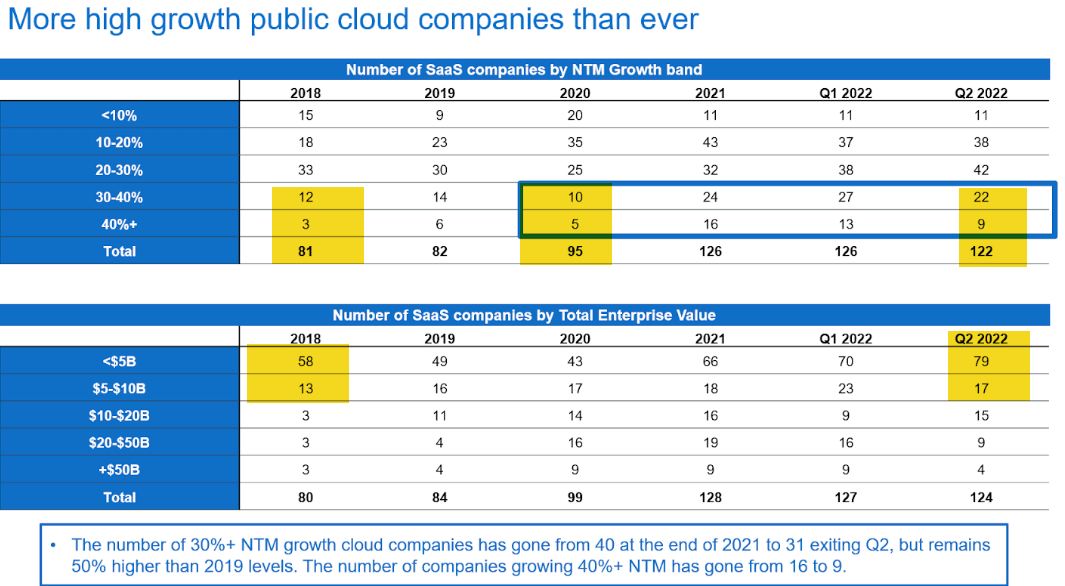
5/ The caveat, though, is that growth is still important (2.5x factor regression), but the factor has lessened over time (bottom left chart)
Investors cant get over growth (just yet); just accompany it with FCF.
Some other key insights below..
6/ More on private mrkts
A deceleration in the number of software deals, down 28% YoY
From a high of $44B -> $28B
Likely effects of the frozen IPO + late-stage deals being marked up against public comps, though from what I hear, best-of-breed cos are still raising privately.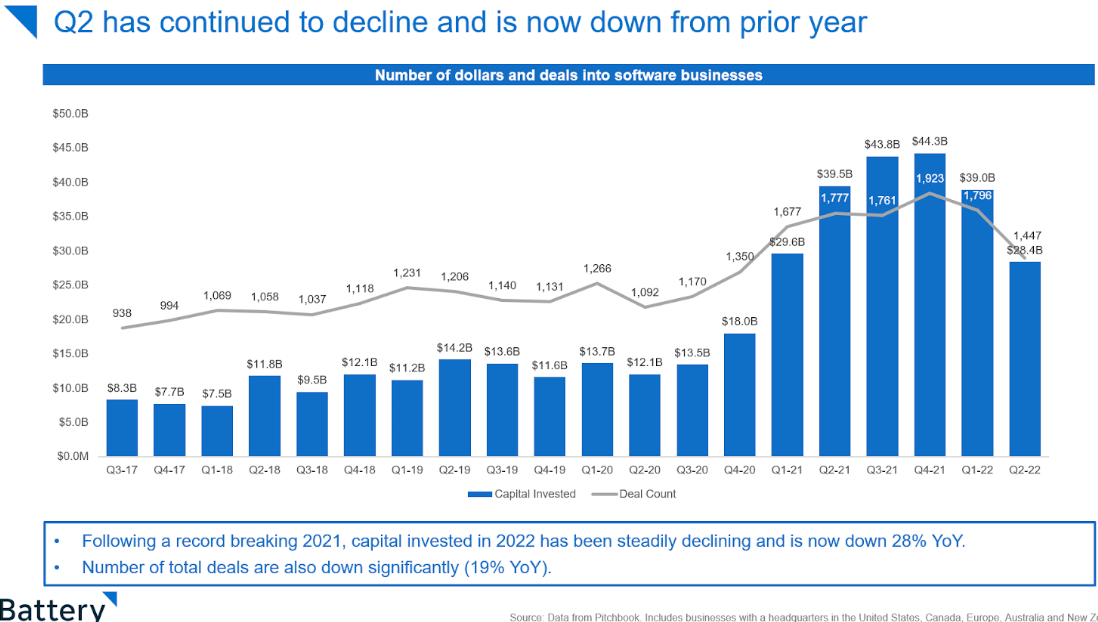
7/Spread btw Cloud software valuations btw Private vs Public markets:
I added some annotations to show how in 2020 valuations for public growth cos grew faster... until venture capital got caught up in FOMO in 2021.
There is likely more compression ahead in privates.. I think??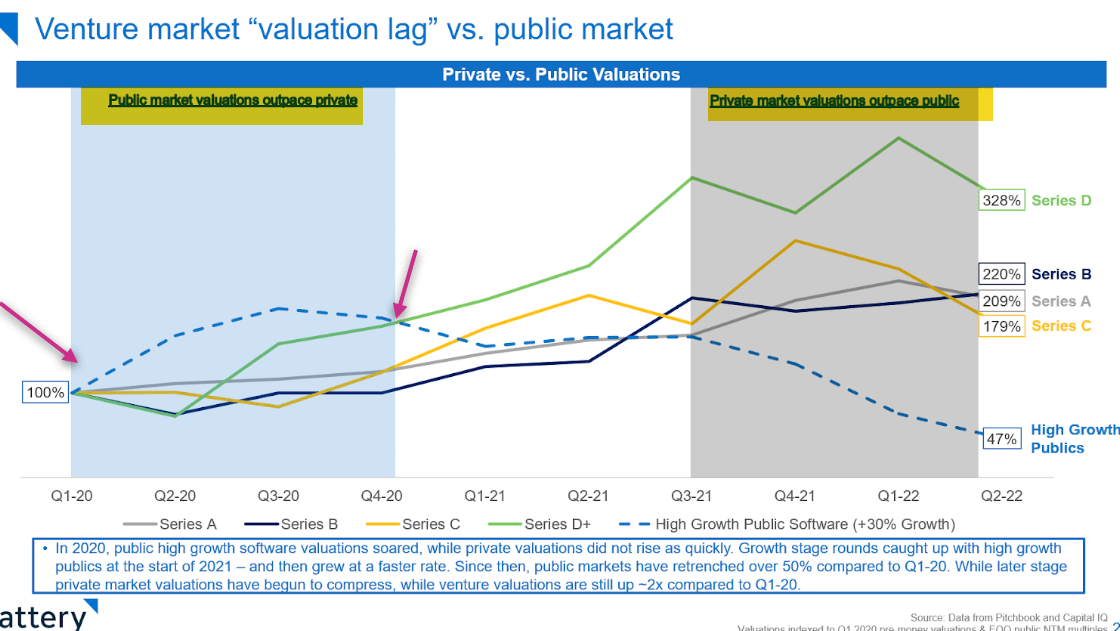
8/ More details
For ex. Series A + B deals/valuations are still holding steady. Not surprising.
It gets interesting when you see the deal funding fall as you move from Series B to Series D rounds.
9/ Contrasting companies in the Yellow vs. Blue Zone.
Quite a difference in traditional SaaS vs. modern cloud software.
The Red zone has gotten even worse than Q1! Many ngmi cos lol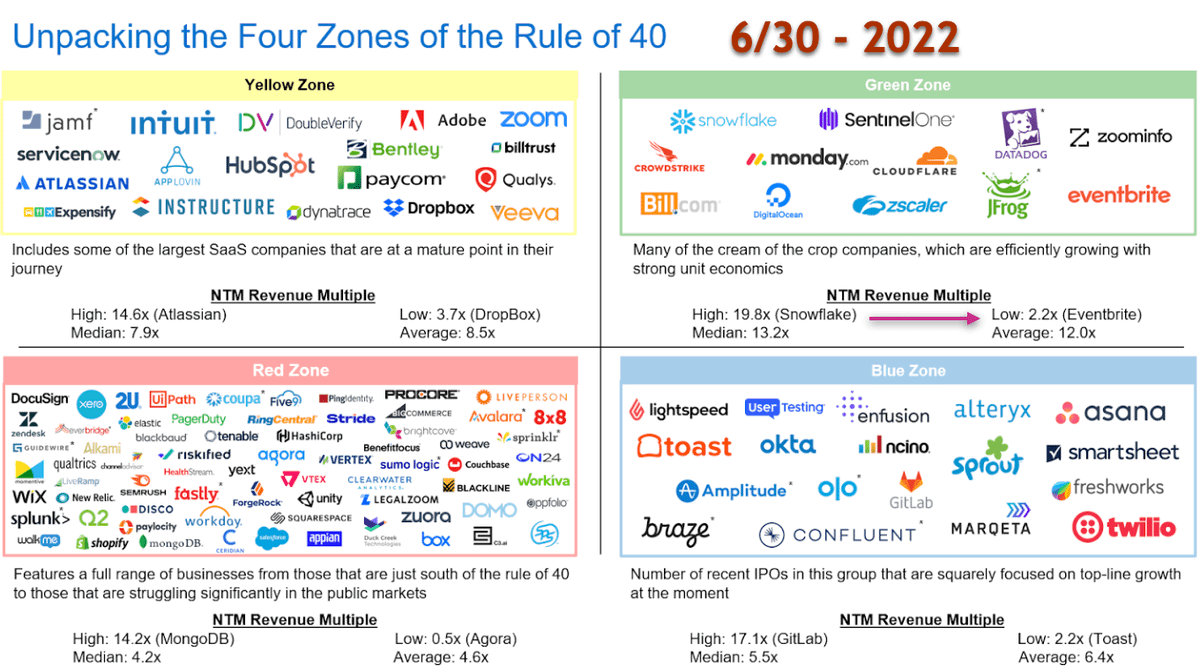
10/ Off-script: Geographical funding and deals:
Personally, I found this chart fun that funding deal activity "in other areas of the US" actually grew +35% vs -v negative in other main regions.
Good to see.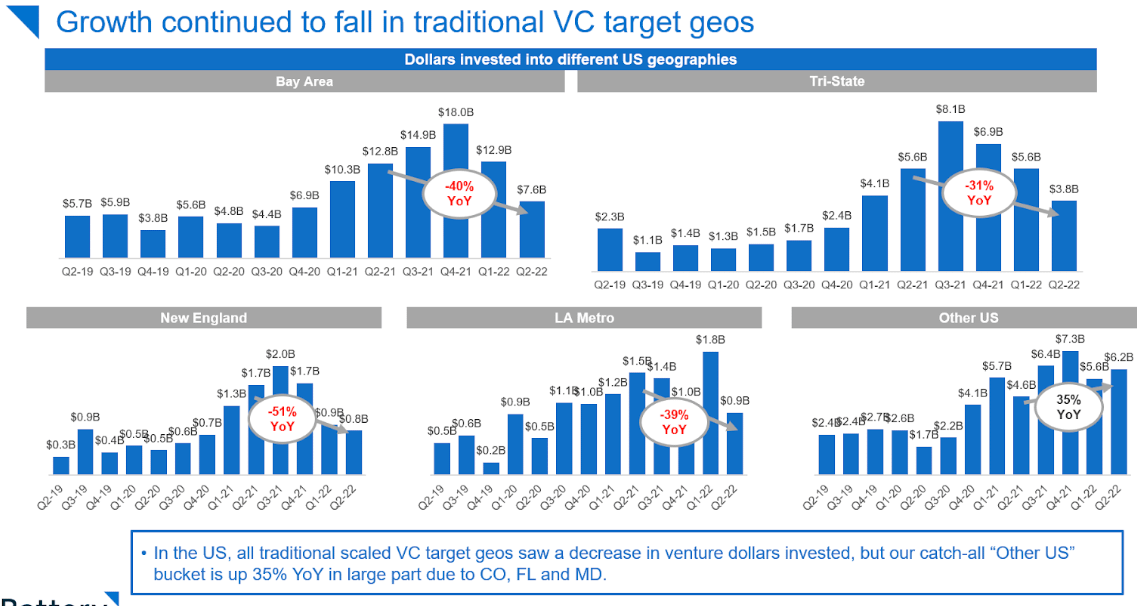
11/ Tl;dr - This has truly been a great re-rating almost never seen.
The key question is if multiples will further compress after JPowell's comment on Friday?
I hate to say but looking at the valuations in private mrkts vs. publics; makes me think there is much more pain ahead.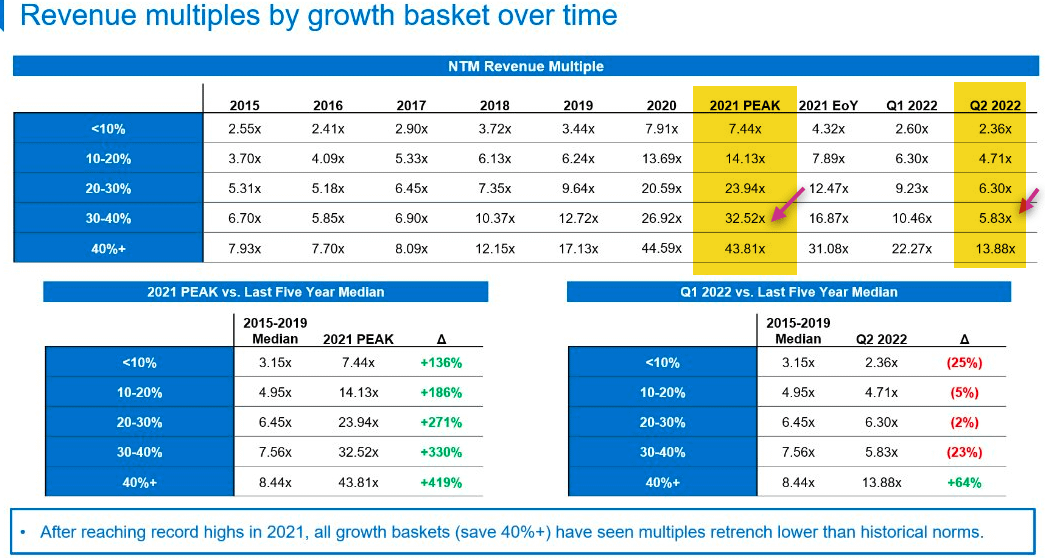
12/ Appendix: For more details -
The full link to the deck can be found here:
docs.google.com/presentation/d/1zHKMAVeqItqyAuu0RYraKghfiG6Hz4LJfrP6vPeYKU0/edit?usp=sharing
Kudos to @NeerajVC @BrandonGleklen @OliviaHenkoff and
@JackMattei for the work here!
13/ If you want to learn more about the Four zones on the earlier valuation chart and compare it to Q1 2022.
Check out this great thread by @BrandonGleklen for more.
twitter.com/BrandonGleklen/status/1532758262998769671?s=20&t=4cBScPHU09xfi9e84TM8eg

Francis
@InvestiAnalyst
Founder, Software Analyst Cyber Research | Tweets on Cybersecurity & AI/ML | Catholic. Distance Runner. | Ex Cyber Research | Ex AI PM.