
Today, I'll be analysing what makes one NFT marketplace successful over another.
This analysis will compare @decentraland to @opensea using @Increment_HQ.
Hypothesis: The diversity and quality of NFT offerings contribute to the success of a marketplace
Decentraland and Opensea are both NFT ecosystems that are available on the Ethereum and Polygon chain. So, we'll make our comparison on both chains.
First, I'll consider the overall NFT traction on the Ethereum and Polygon chains. To measure NFT traction on Ethereum & Polygon chains, let's look at the active NFT collections.
They represent ongoing engagement, market demand, user adoption, and ecosystem growth.
The active collections represent the NFT projects with consistent user interaction, such as sales, bids, trades, or interactions.
📈 Ethereum leads with the most NFT collections, while Polygon shows promising growth with a quarter of Ethereum's count.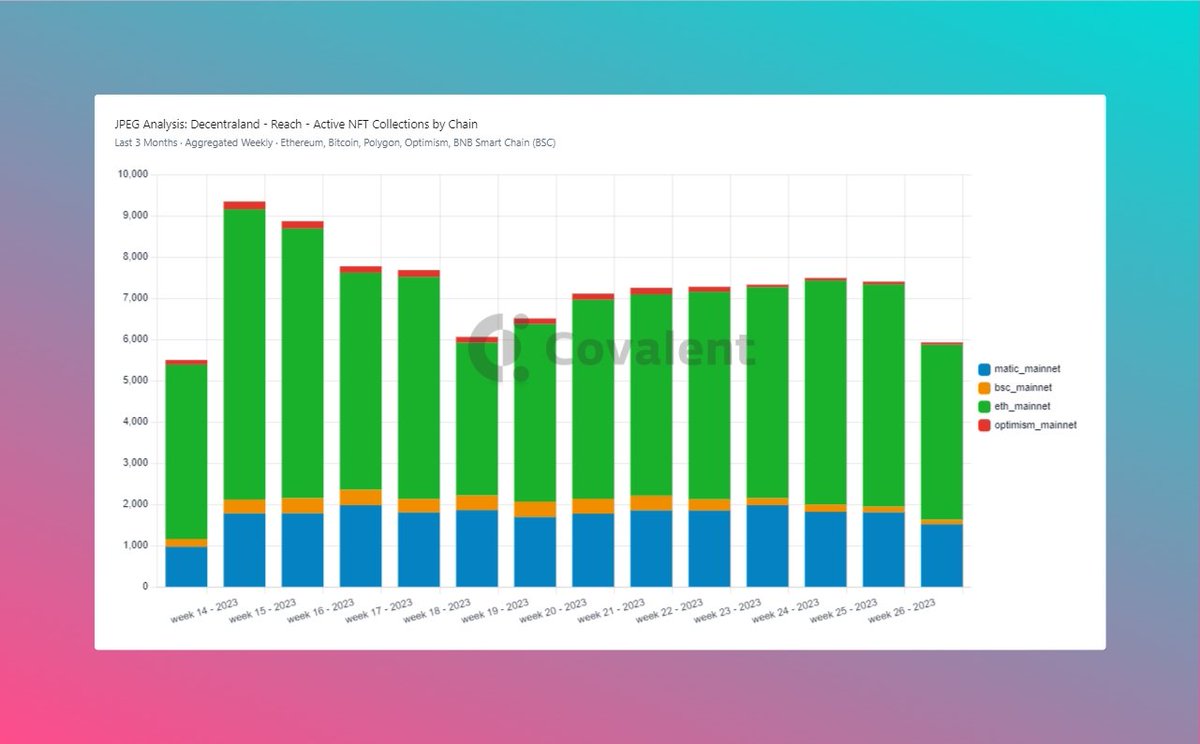
Over the past 3 months, Ethereum saw active collections ranging from 4K to 7K weekly. A marketplace operating on both ecosystems can tap into vast opportunities, target different audiences, and stay competitive in the dynamic NFT landscape.
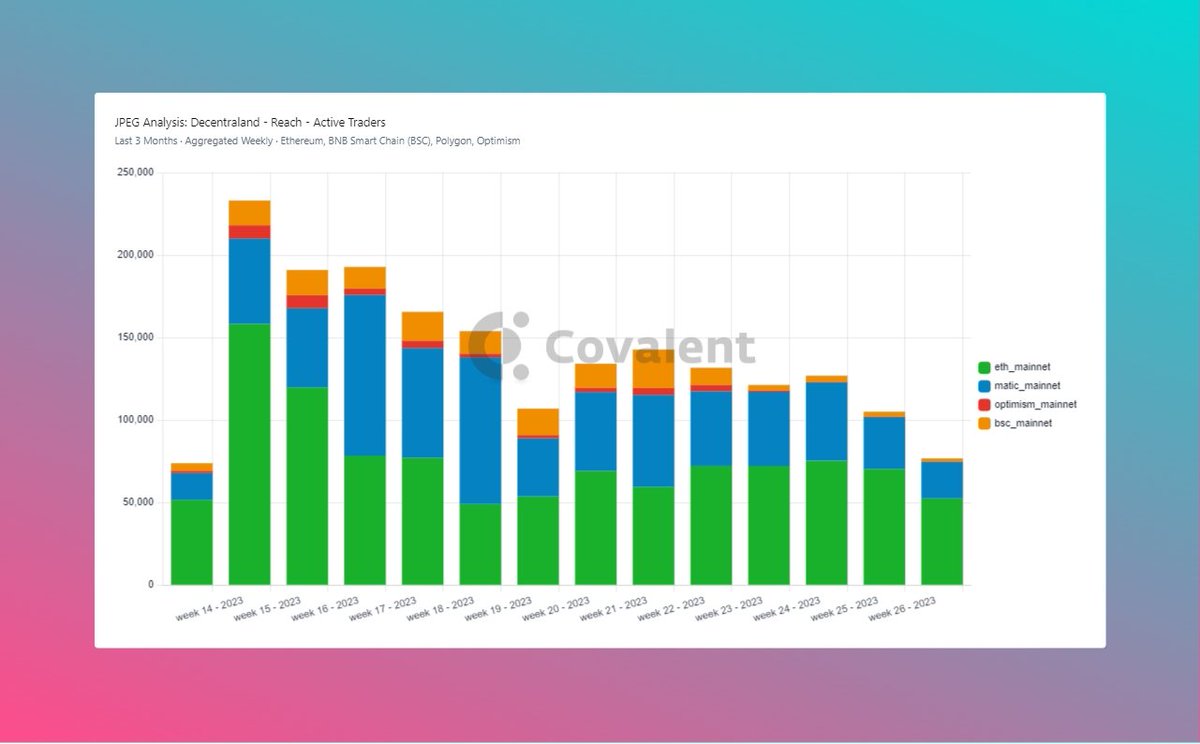
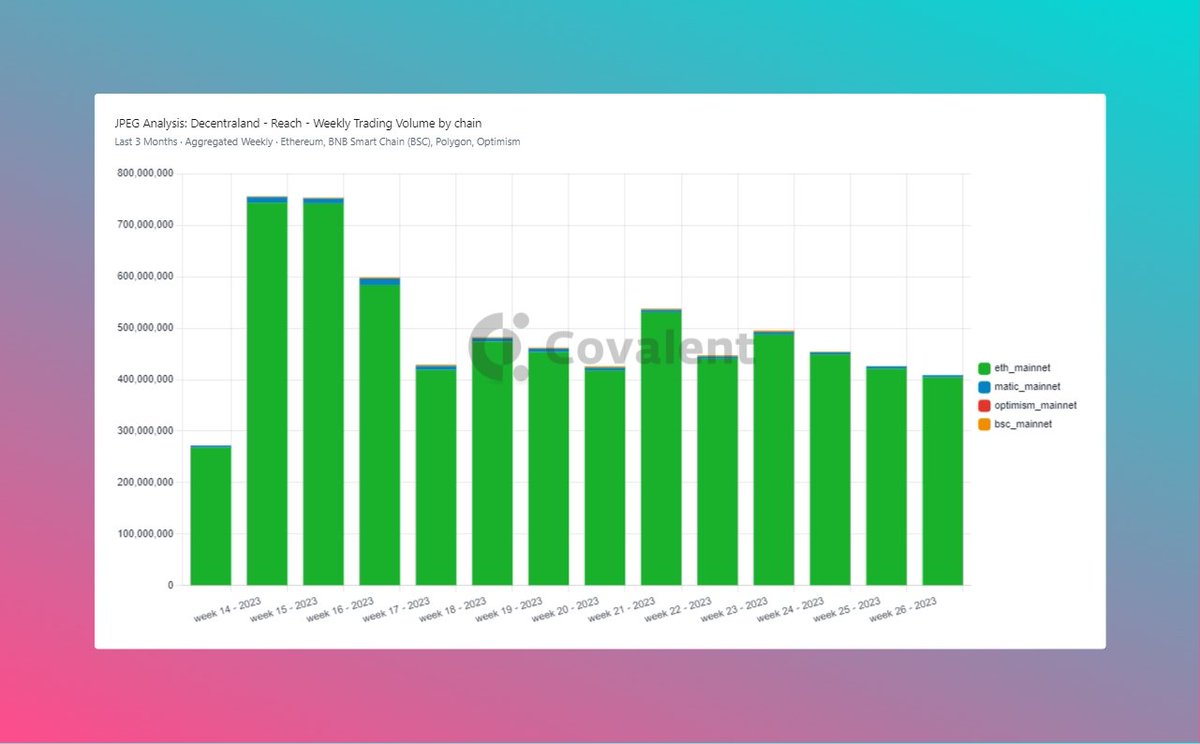
Because our focus is on Decentraland, we take a look at the weekly trading volume by chain and active traders by chain.
We compared the different chains to understand which chain contributed the most to the growth of this multi-chain NFT ecosystem.
Active traders and weekly volume are key metrics for gauging reach in trading markets. Active traders represent the number of individuals actively participating in trades, while weekly volume reflects the total value of trades conducted within a week.
Ethereum dominates trading volume, while Polygon faces challenges attracting active traders. The marketplace has also seen a decline in active traders, dropping from 240k to 100k in the past 3 weeks. Despite maintaining a range of 700M to 400M, trading volume shows a decline.
Surprisingly, when we measure the weekly NFT count by chain, Polygon takes over decentraland. It has been so for the past 27 weeks of this year. Why is this so?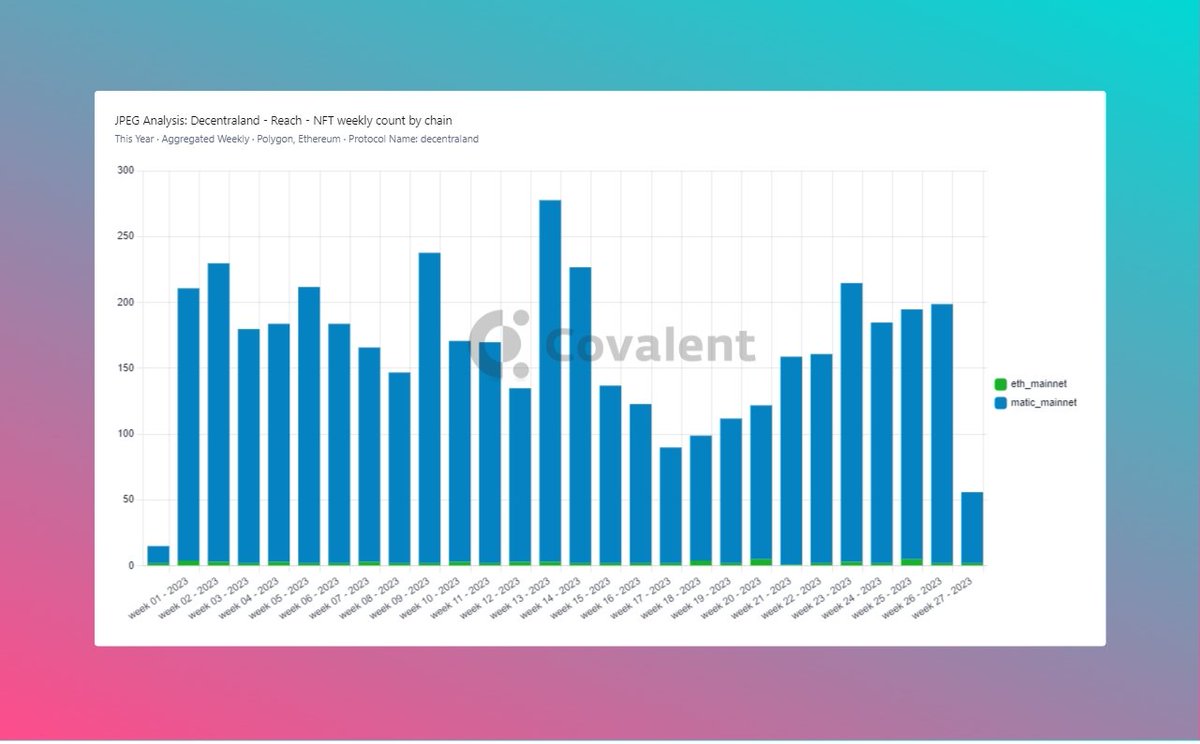
Well, we could correlate it to the notion that gas fees are cheaper on Polygon than Ethereum. l2fees.info
Now, we delve into comparing Opensea to Decentraland.
You may wonder, why compare decentraland to Opensea when they have different business models?
Well, if they operate in the same industry (NFTs), they are your competitors.
Competing for customers, resources, and market share, it's vital to understand and monitor other NFT platforms.
Also, we noticed that most of decentraland's userbase buyers and sellers are being shared majorly with Opensea, then blur and x2y2 taking a tiny cut.
Unlike for the buyers user base distribution, most sellers would sell more on Opensea than they would on decentraland.
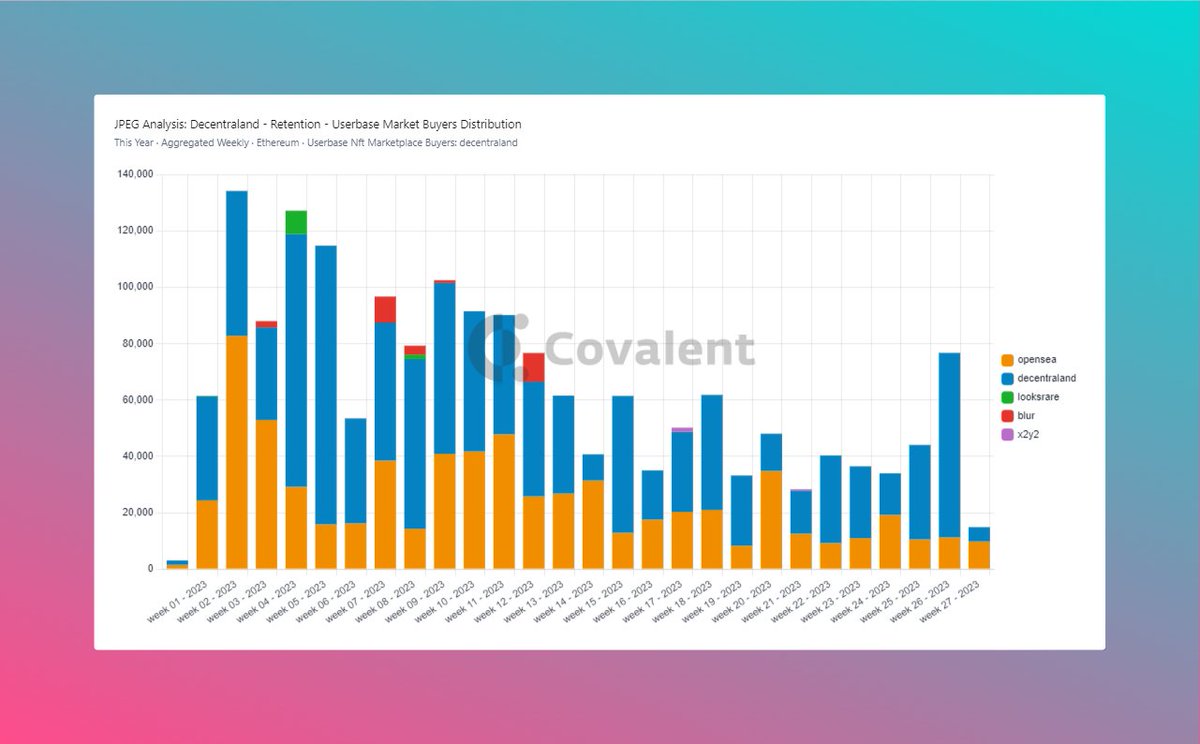
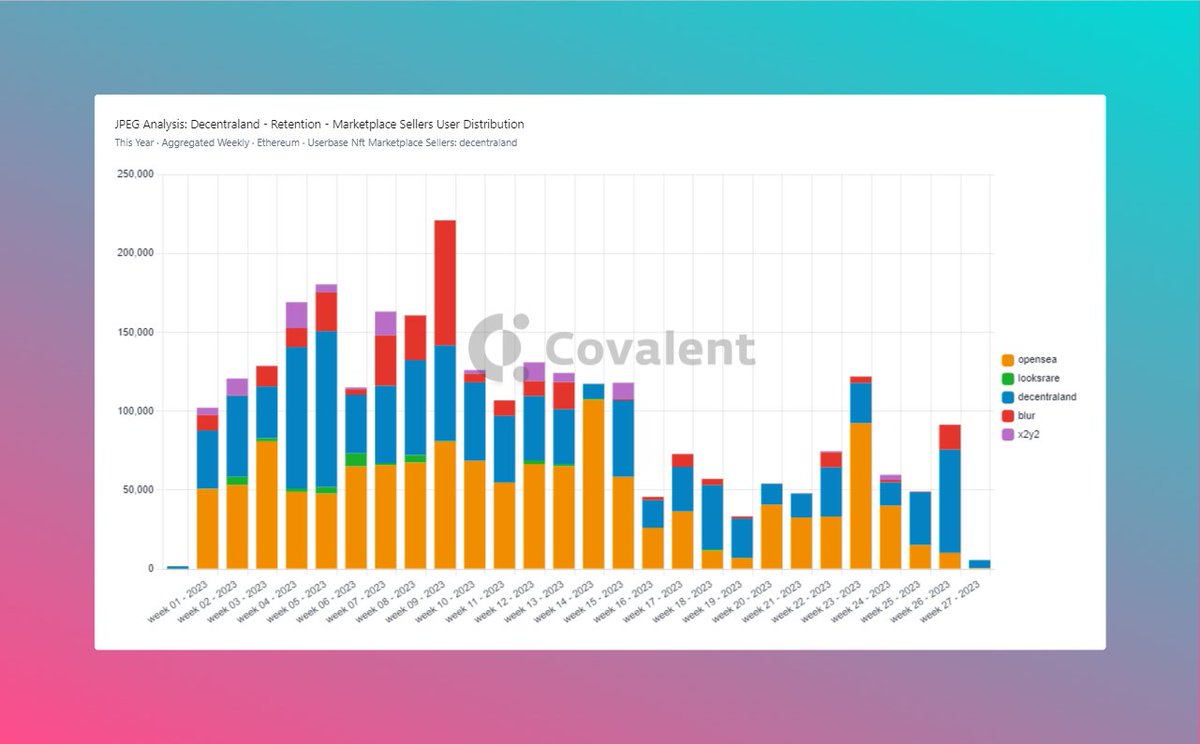
An extra talking point would be how Blur came into the picture in February, competing with Opensea for decentraland's users.
The spike could be attributed to the blur token launch and airdrop distribution which happened on February 14th.
twitter.com/blur_io/status/1616125798951571456?t=PRGArb_FVDZDpQ-VNm8J7g&s=19
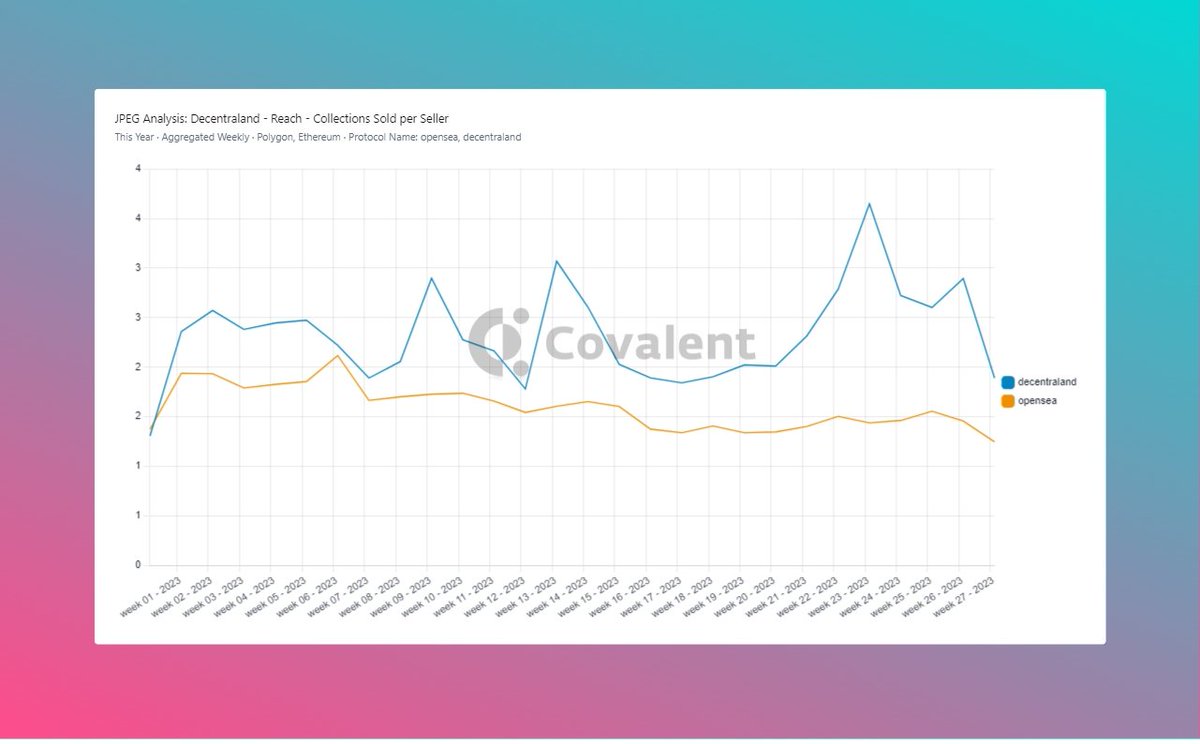
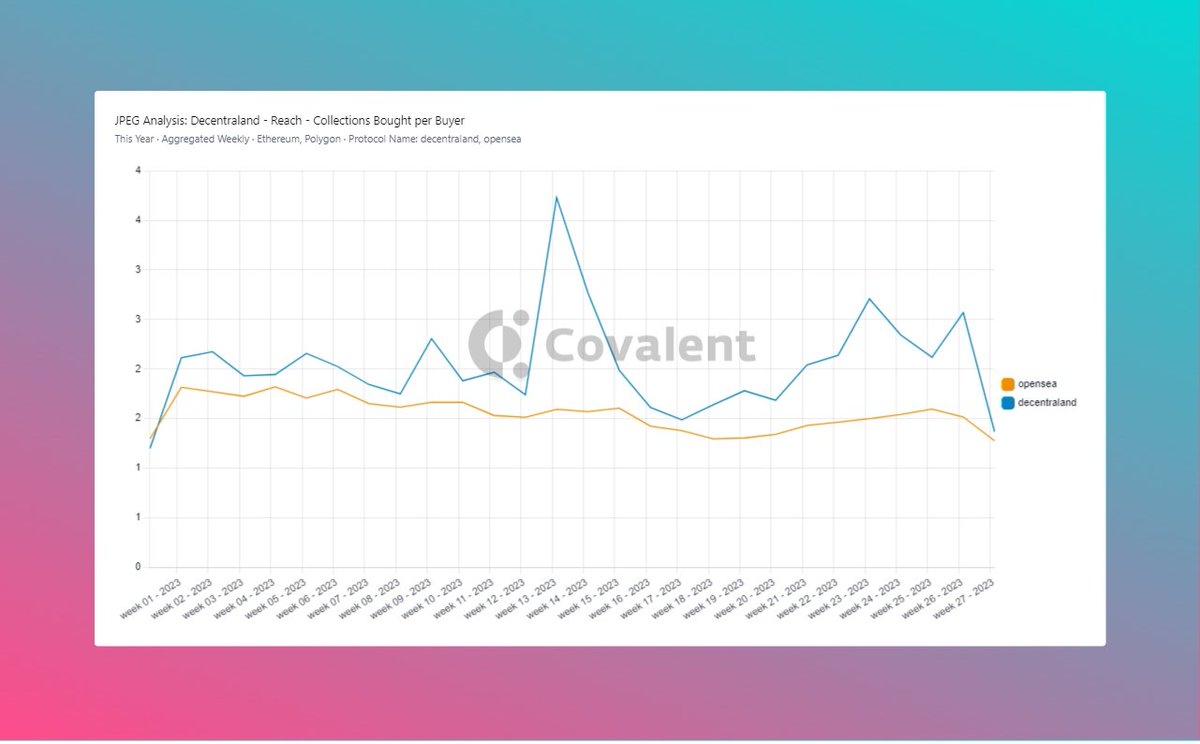
We would compare the number of unique NFT collections, collections bought per buyer, and collection sold per seller on both dApps. These metrics unveil the diversity of NFT offerings, buyer behavior, and seller activity.
Analyzing them helps understand market saturation, user engagement, and the dynamics of NFT transactions.
Opensea had more unique NFT collections than decentraland. However, buyer and seller behavior were almost the same.
Both marketplace had buyer and sellers buying and selling 2 collections weekly respectively.
However, there were constant spikes for decentraland buyers and sellers. Sometimes going as high as 4 collections.
Further on the reach, let's talk about Variety of the top collections on both marketplaces. Assessing the variety of collections, I examined the contribution of each project to the ecosystem's sales.
By analyzing the sales generated by different projects throughout the year, I gained insights into the diversity and impact of each project. This metric provides a sense of the variety within the ecosystem, highlighting the range of artistic styles, themes, and creators.
💥 In Decentraland, 90% of top collections (by sales) are dominated by Decentraland LAND and Estate. On the other hand, Opensea showcases more diversity, with 6 collections receiving 2-4% of total sales and 7 projects contributing 1-2%.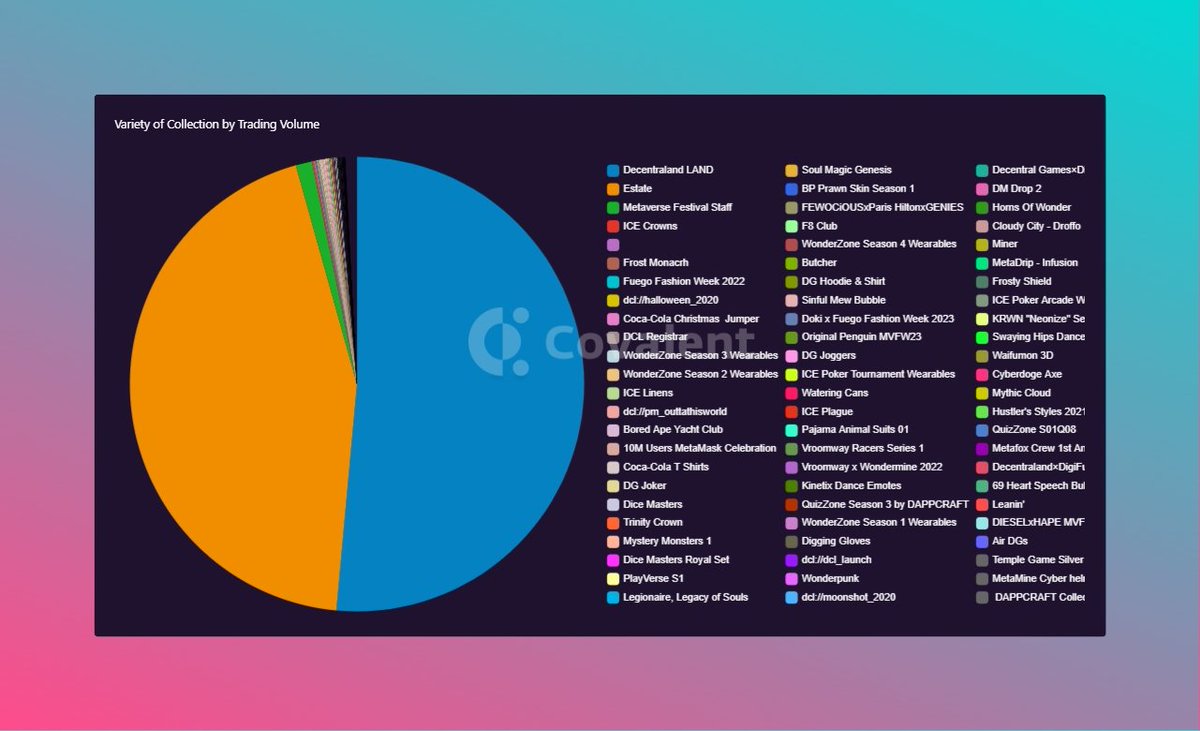
This demonstrates that around 30% of sales are driven from 10-15 projects, highlighting a broader range of contributors and less reliance on a few projects.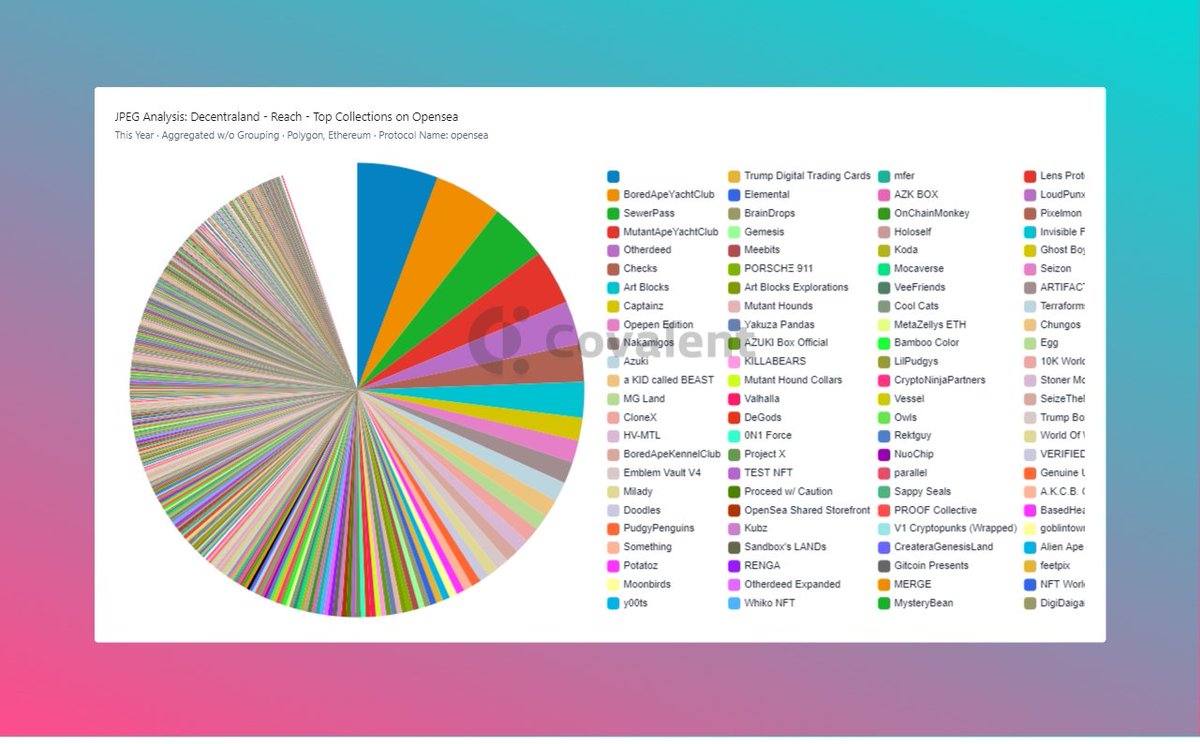
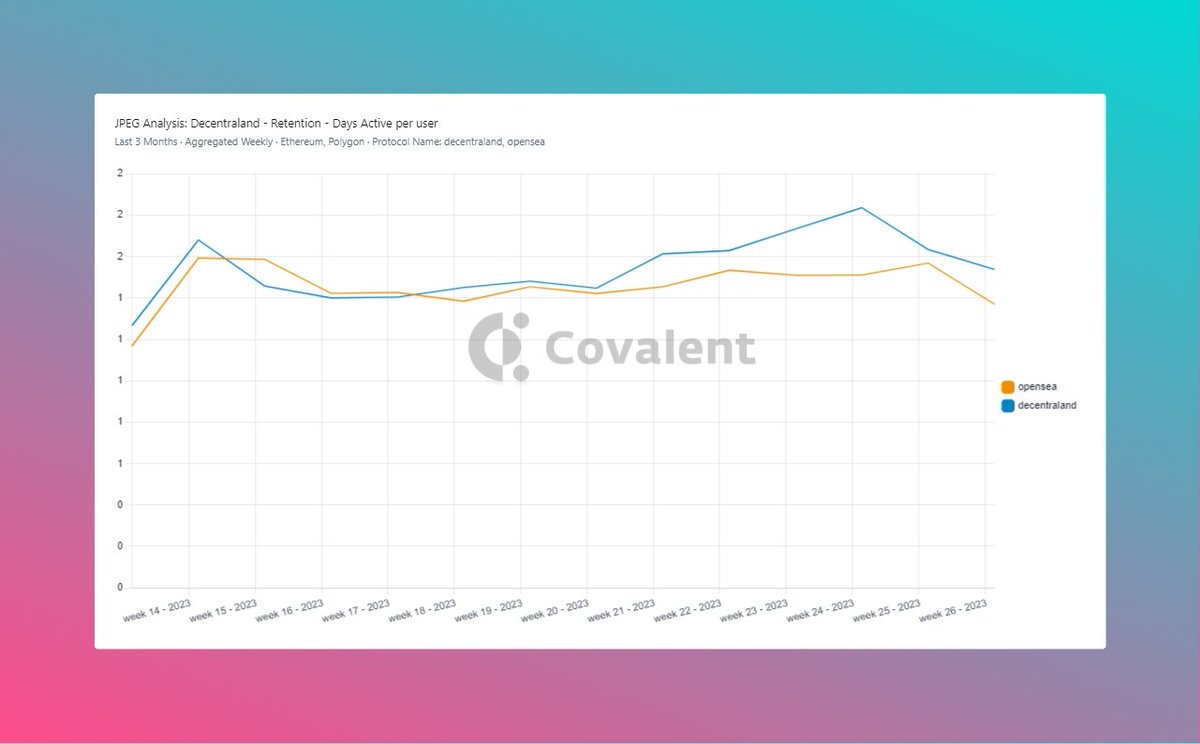
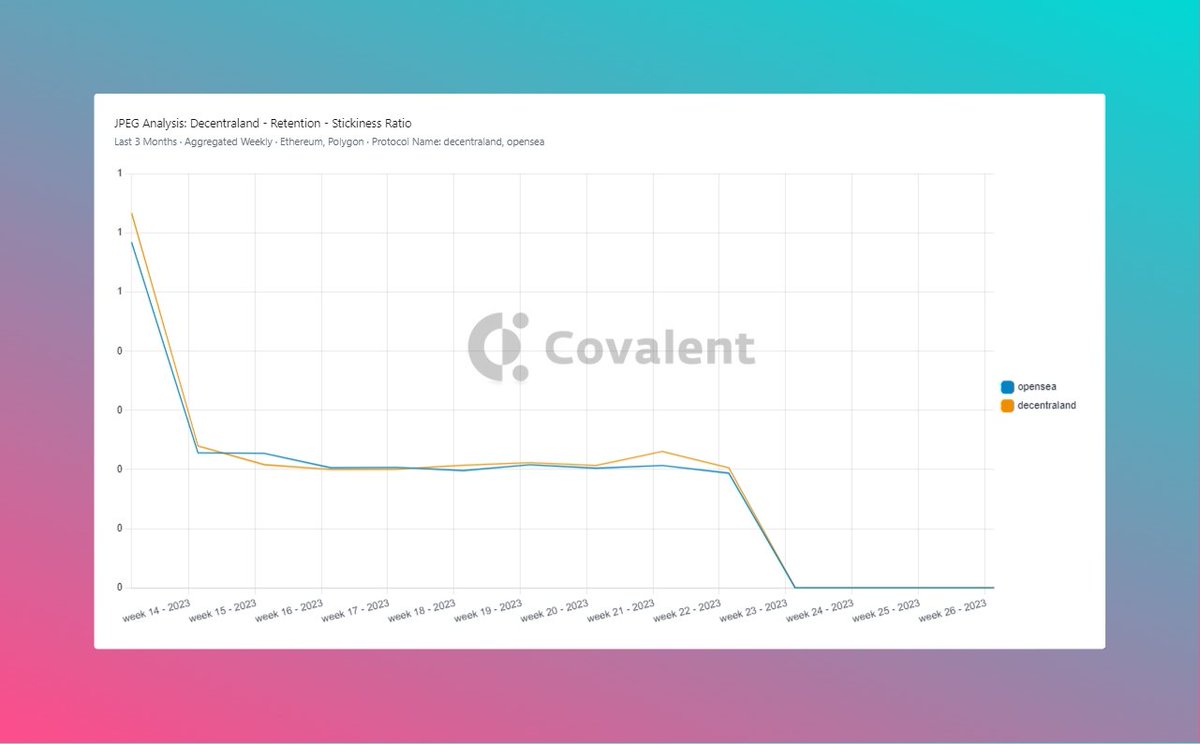
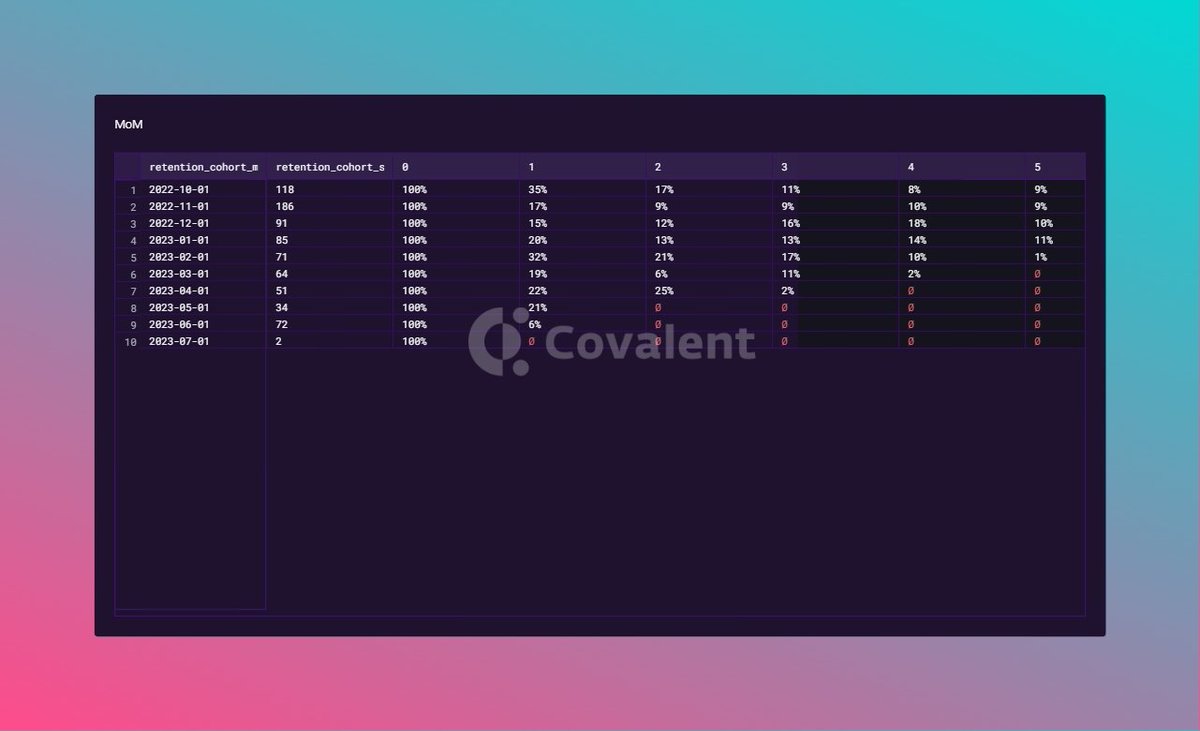
In terms of retention, I use metrics like days active per user, stickiness ratio and Month-on-month cohort retention. These metrics were chosen to understand user activity, retention, and long-term engagement with the platform.
Days active per user measures engagement, stickiness ratio gauges loyalty. Users on both markets are active 1 day/week. Stickiness ratio showed initial promise but declined rapidly. Both products lack stickiness, so improving user retention is key.
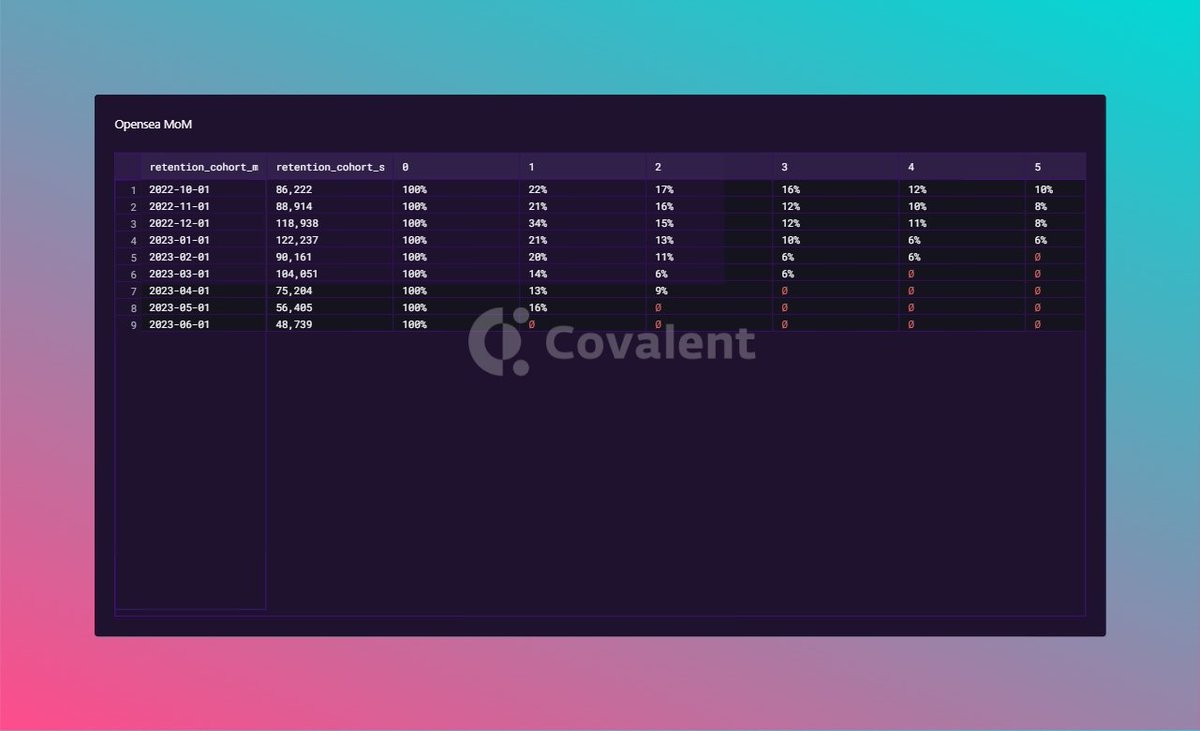
Month-on-month cohort retention measures user return rates over time. Opensea has a larger cohort size, but decentraland retains more users overall. However, both platforms face challenges in retaining cohorts over extended periods.
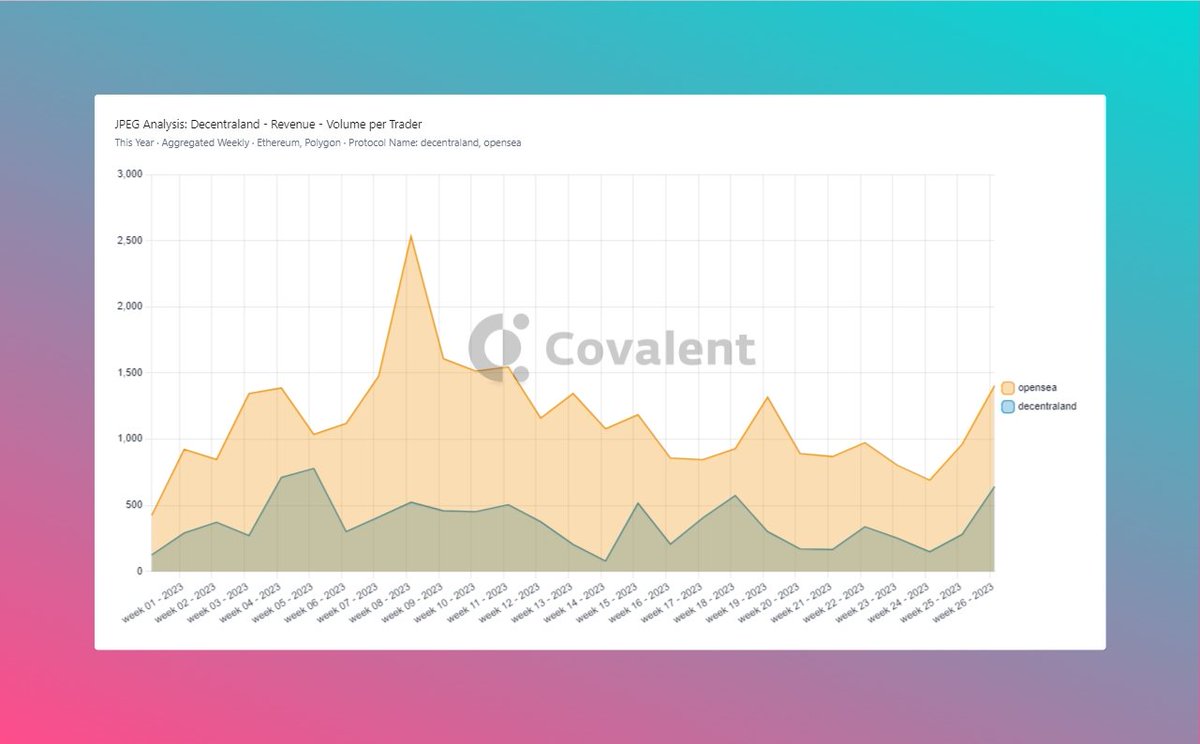
Now let's explore the relationship between the diversity of NFT collections to other success indicators (revenue) such as sales volume, 30-day moving average of average sales, monthly growth size and volume per trader.
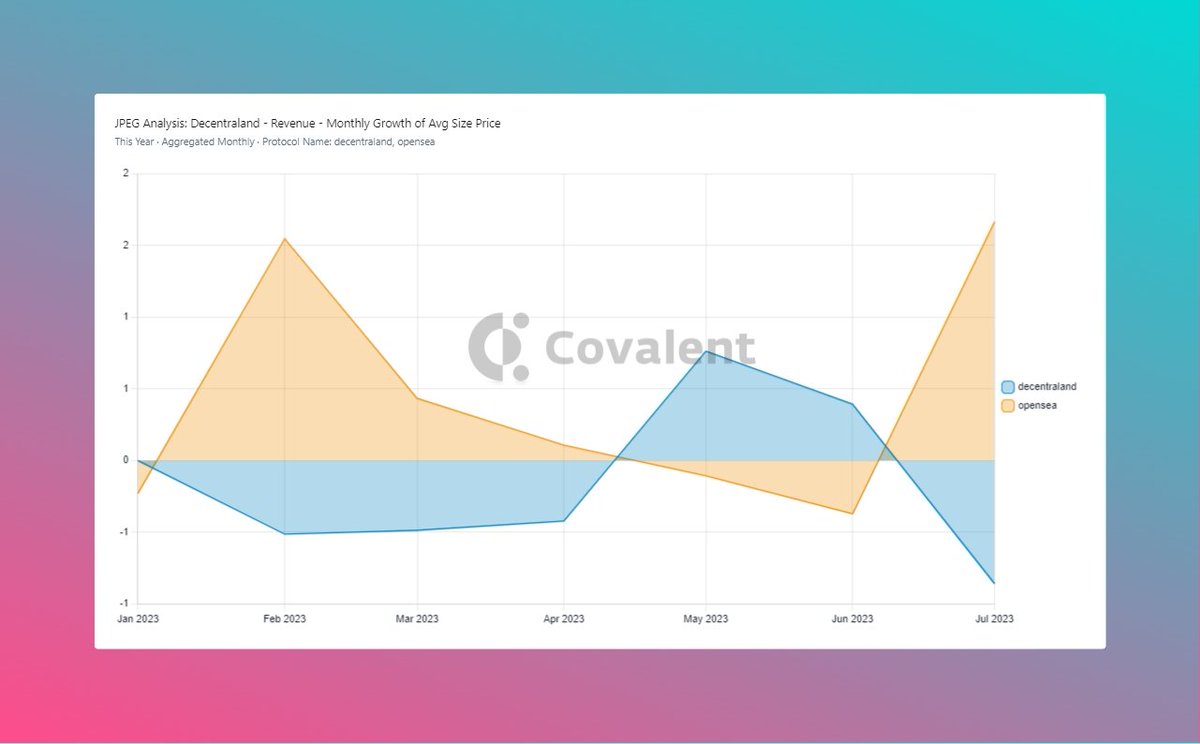
📈 Weekly Volume per Trader & Monthly Growth:
Decentraland lags behind Opensea with 3x less volume per trader.
Monthly average growth indicates Decentraland struggling to stay above 0, except for mid-May to early June.
💰 Daily Sales Volume:
Decentraland struggles with low sales compared to Opensea. Daily sales range from $100 to $5000 for Decentraland, while Opensea reaches millions of dollars.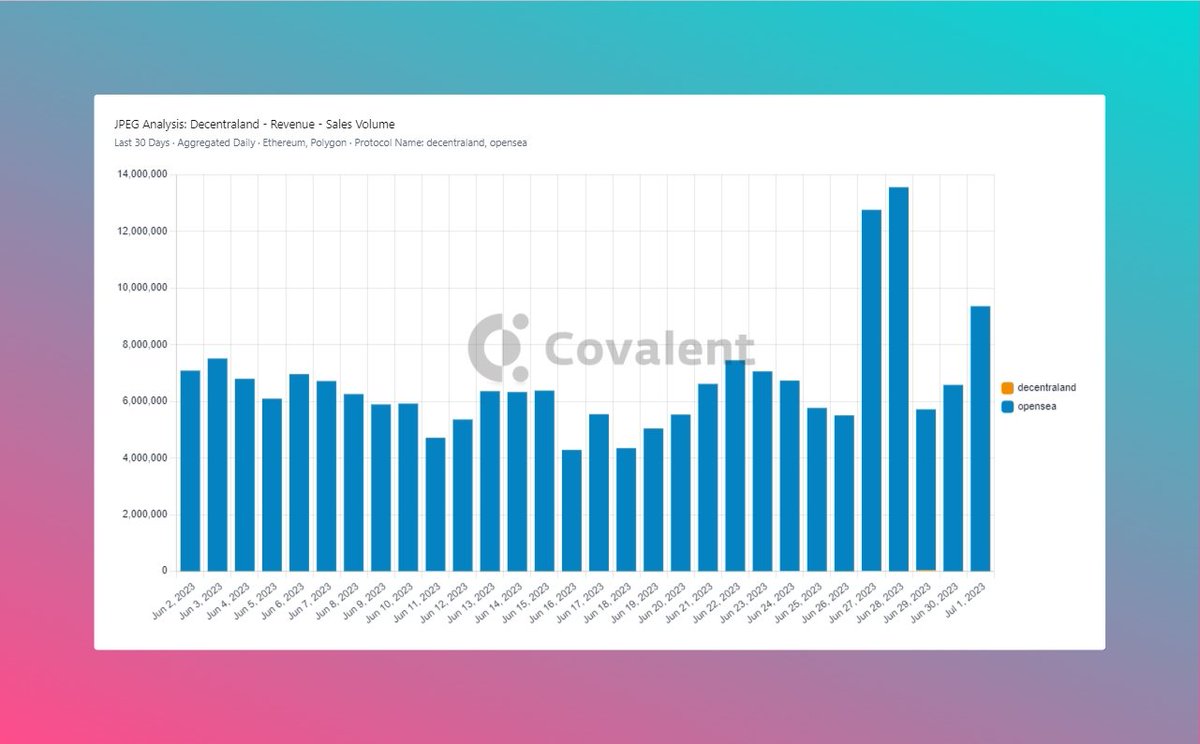
📊 Moving Average of 30-day Sales:
Both Decentraland and Opensea show similar average sales trends. However, Decentraland has numerous days with no average sales recorded.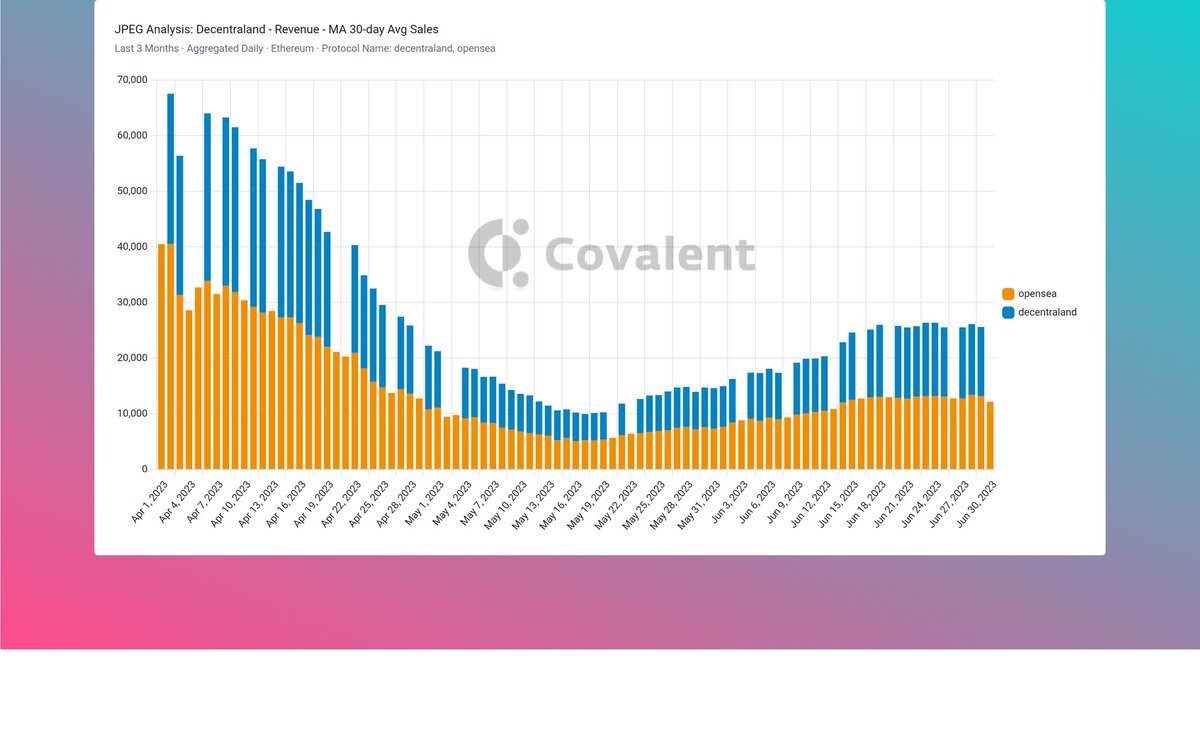
@Increment_HQ @Covalent_HQ Opensea's success in the NFT market can be attributed to their focus on trending collections.
They strategically align with the broader NFT trends, leveraging marketing efforts to gain attention and drive sales.
@Increment_HQ @Covalent_HQ On the other hand, Decentraland has faced challenges in generating sales beyond its major NFTs like Estate and LAND.
To overcome this, they recently launched Decentraland Studios, fostering innovation and creativity.
decentraland.org/blog/community-projects/decentraland-studios-a-verified-registry-of-creators-in-the-metaverse
@Increment_HQ @Covalent_HQ To further enhance sales and reach, Decentraland should consider collaborating with influential NFT artists, brands, and influencers. By partnering with renowned NFT projects, they can tap into their existing fan base and expand their reach to new audiences.
@Increment_HQ @Covalent_HQ Additionally, @decentraland can explore a broader range of #NFT projects to increase the diversity of collections available on their platform.
By offering a wider selection of NFTs, they can attract a more diverse group of buyers and cater to various tastes and preferences.