Hi - Back again with some data insights into pre-seed startup valuations.
This time, I want to talk about my favorite chart for both founders and VCs - The traction slide
#Startups #VentureCapital #Entrepreneurs #Founders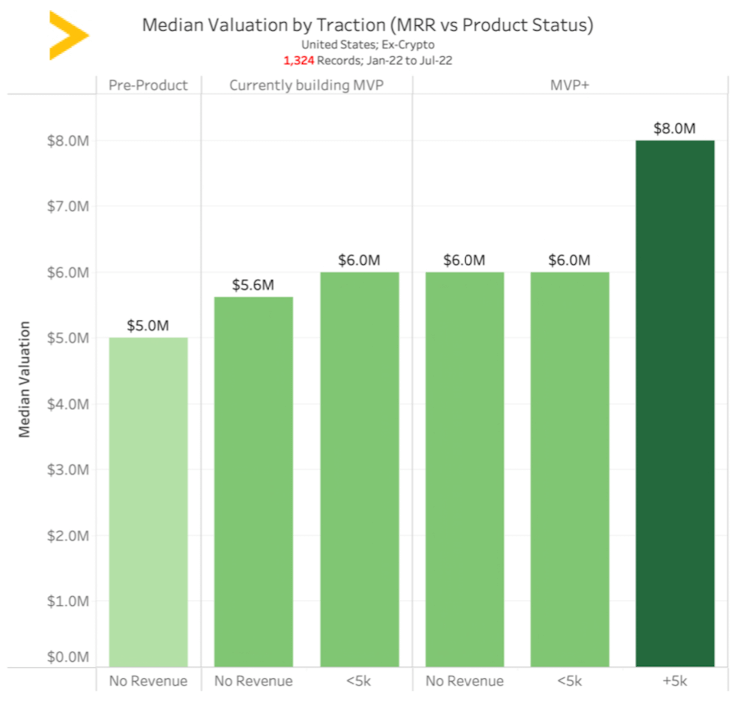
Explaining the chart - this is the median and mean valuation across 1300+ US startups (Ex-crypto) that submitted their deal to @HustleFundVC this year, bucketed by MRR and product status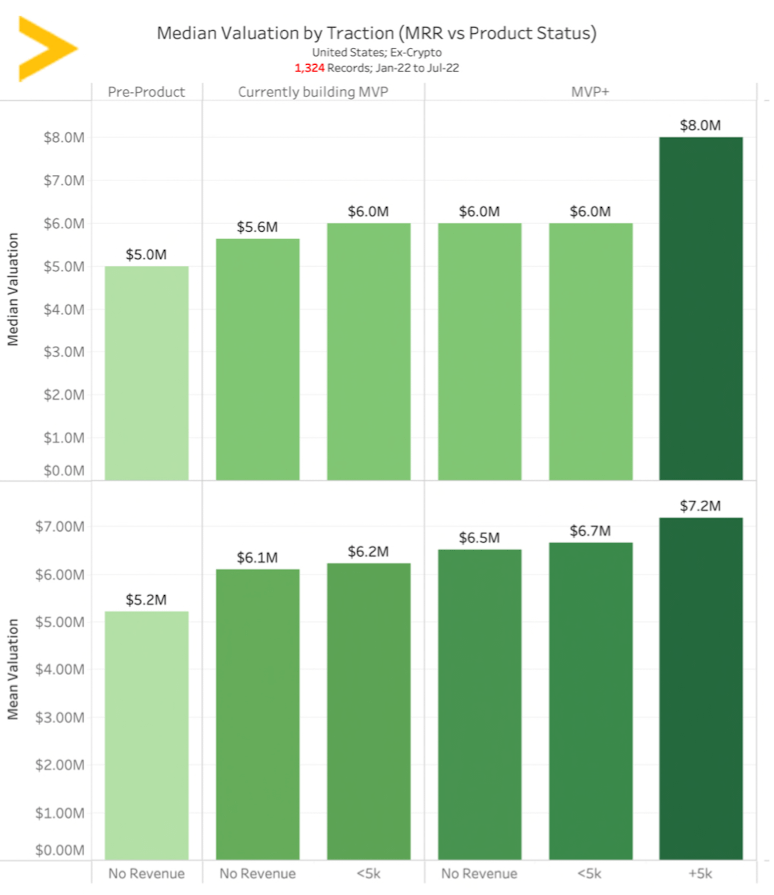
Why I love it pt 1 - it's a great representation of what matters and how much it matters when starting your startup - building an MVP of product AND acquisition
Per the chart, the biggest boosts you get in valuation are from
- building something vs just an idea
- executing your initial acquisition process multiple times
IMO, the boost is because these are the most important milestones when initially building your startup
Why I love it pt 2 - I think this is a decent baseline for how the market is pricing startups at various stages within pre-seed.
To be clear, these values are far from perfect - many important factors are not represented here, each startup is unique, and there is a lot of variation (1Z=60% of avg value for each bucket!)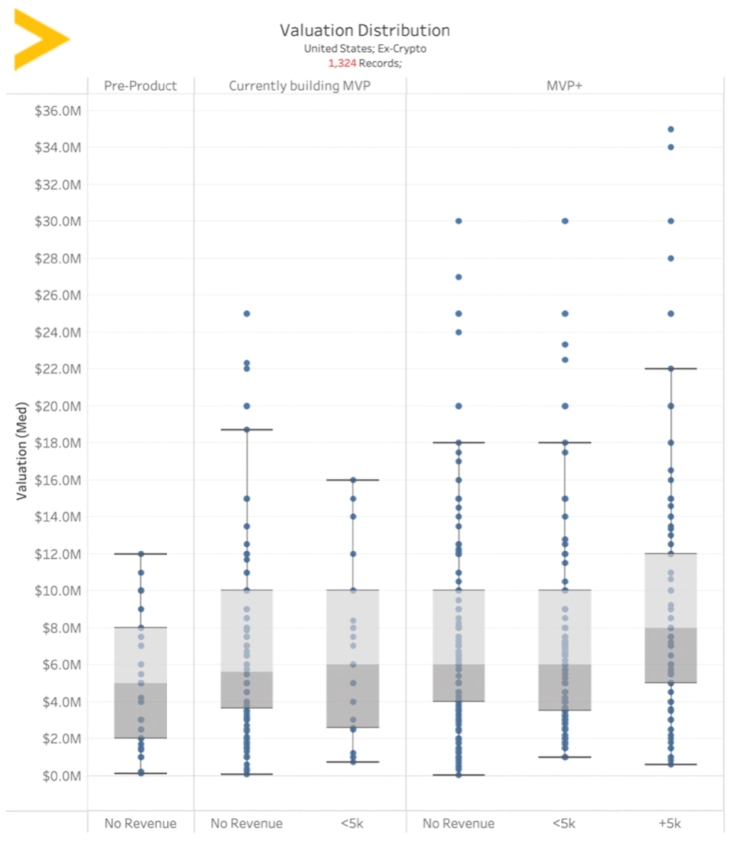
However, when it comes to the art of setting a valuation for your company, I think that a pattern that has held for several years based on statistically significant variables is a pretty good place to start and is hopefully helpful!
As always - thanks for your time! All comments, questions, and feedback are appreciated.
You can read the unrolled version of this thread here: typefully.com/will_bricker/bHwwUgn

will bricker
@will_bricker
Born and raised New Yorker, VC @hustlefundvc, diving fanatic, and plant connoisseur. Good with data, mediocre with words.